


44.9118
-93.5165
Driving Directions
Street View
Photos
Map
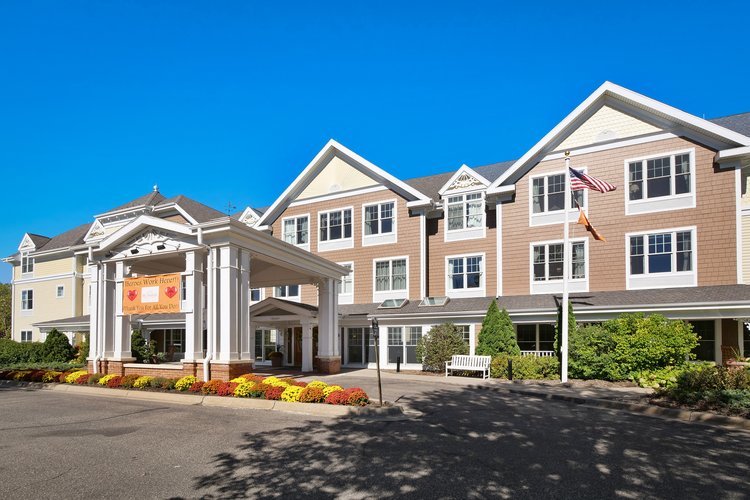
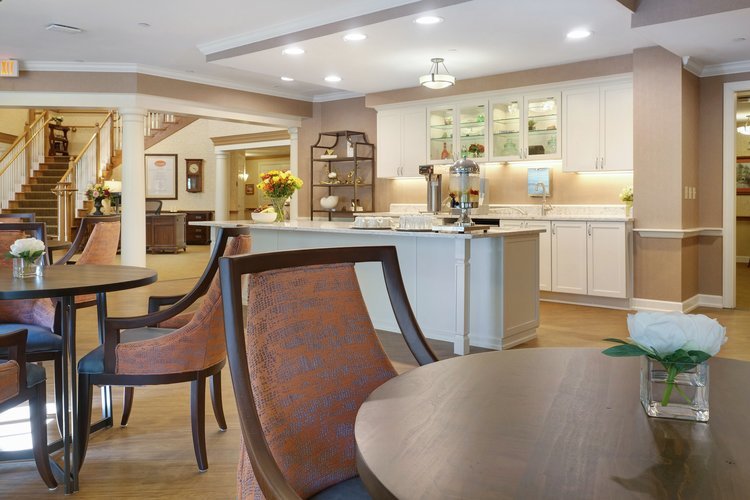
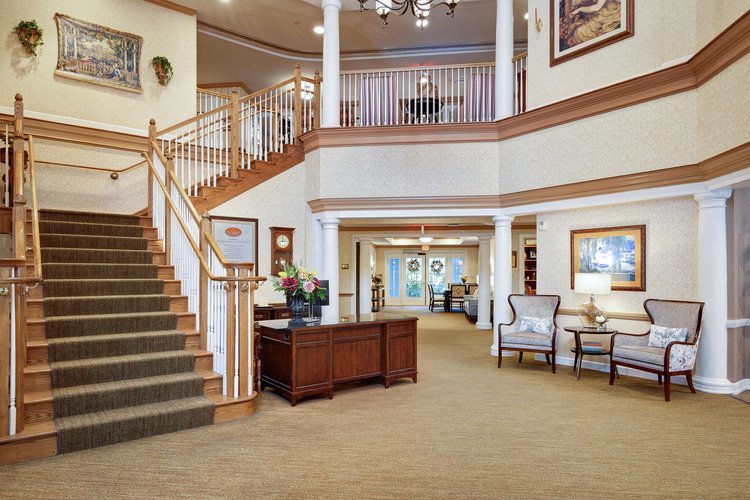
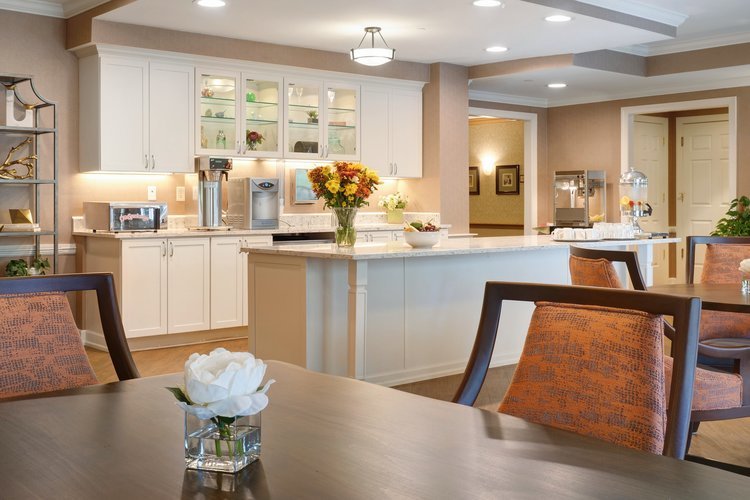
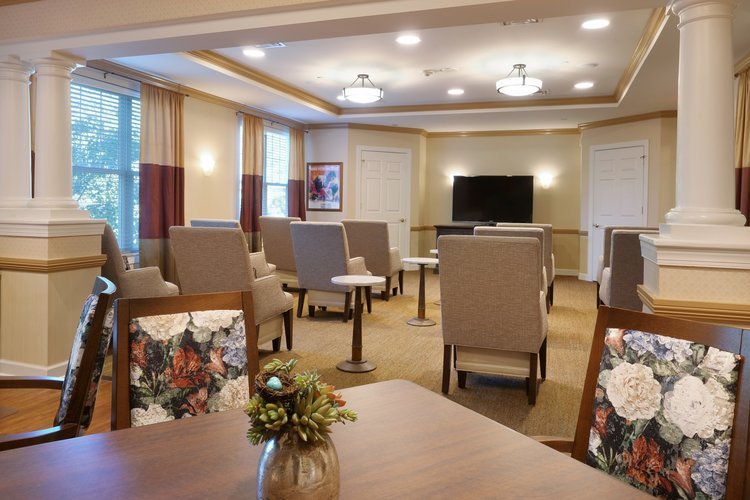
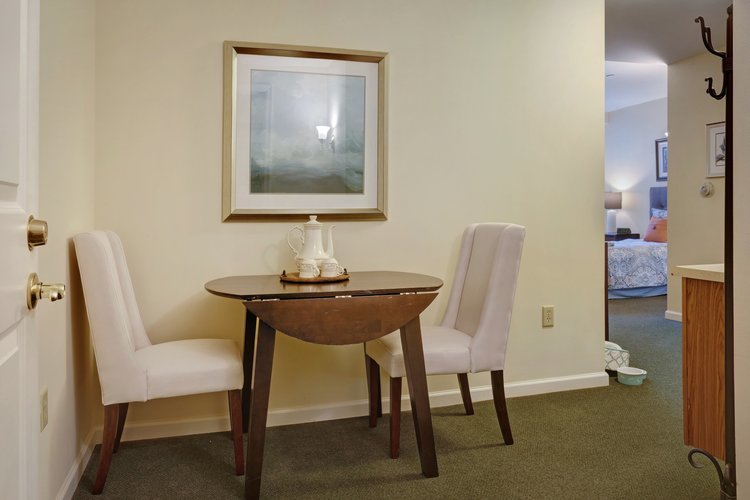
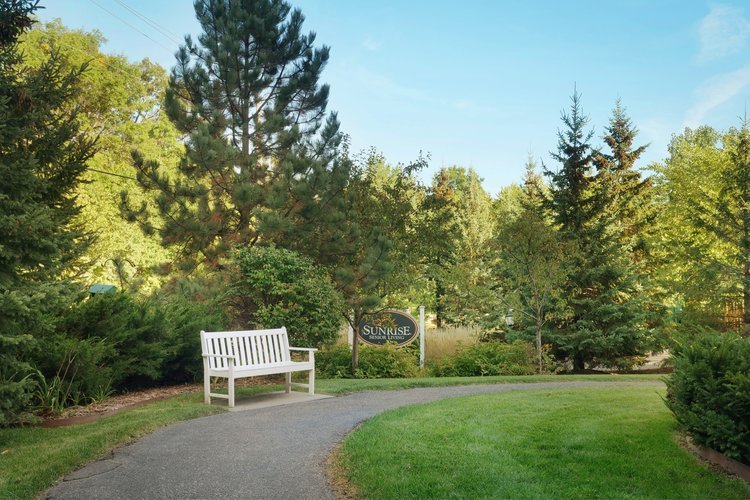
Sunrise of Minnetonka
$ Call for Rates
18605 Old Excelsior Blvd., Minnetonka, MN 55345
Overview
Care Types: Assisted Living, Alzheimer’s Care
Sunrise Senior Living is a senior housing facility that focuses on the individual needs and preferences of each resident. The community is committed to providing quality care for all seniors, and has won more than 280 National Quality Awards – more than any other assisted living provider.
Amenities
- 2-bedroom apartments
- English Language
- Free Transportation Services
- Gym
- Housekeeping Services Available
- In-house Laundry and Drycleaning
- In-house Skilled Nursing
- Laundry Services for Linens
- On-site haircuts/barber services
- Licensed by the State
- Semi-Private Apartments/Rooms
- Single Room Units Available
- Some Pets Are Allowed
- Studio Apartments Available
Contact for available floor plans
Contact for available Payment Options
Neighborhood & Demographics
10 closest amenities
Show Map Show List
10 closest amenities
Grocery stores
Coffee shops
Gas Stations
Restaurants
Pharmacies
Financial services
Powered by 
DEMOGRAPHIC BREAKDOWN
32%
Single
Marital Status
52%
Married Couples
Community
78%
Drove By Themselves
Commute
3%
Below 9th Grade
Highest Level of Education
27%
Children
Adult vs. Children
13%
0-9
Population by Age
13%
0-9
Males by Age Distribution
12%
0-9
Females by Age Distribution
Males by Age Distribution
| Status | Percentage |
|---|---|
| 0-9 | 13% |
| 10-19 | 13% |
| 20-29 | 13% |
| 30-39 | 13% |
| 40-49 | 12% |
| 50-59 | 13% |
| 60-69 | 10% |
| 70-79 | 11% |
| 80 Above | 3% |
Females by Age Distribution
| Status | Percentage |
|---|---|
| 0-9 | 12% |
| 10-19 | 12% |
| 20-29 | 12% |
| 30-39 | 12% |
| 40-49 | 12% |
| 50-59 | 14% |
| 60-69 | 10% |
| 70-79 | 11% |
| 80 Above | 5% |
Marital Status
| Status | Percentage |
|---|---|
| Single | 32% |
| Married (Not Separated) | 52% |
| Separated | 1% |
| Widowed | 5% |
| Divorced | 10% |
Community
| Status | Percentage |
|---|---|
| Married Couples | 52% |
| Single Females | 10% |
| Single Males | 4% |
| Living Alone | 10% |
| Living With Family | 24% |
Commute
| Status | Percentage |
|---|---|
| Drove By Themselves | 78% |
| Public Transportation | 3% |
| Carpooled | 9% |
| Walked | 3% |
| Occasional Drive | 0% |
| Work At Home | 5% |
| Other | 2% |
Highest Level of Education
| Status | Percentage |
|---|---|
| Below 9th Grade | 3% |
| Bachelors Degree | 22% |
| High School | 26% |
| College | 22% |
| Associate Degree | 11% |
| 9th to 12th Grade | 5% |
| Graduate | 11% |
Adult vs. Children
| Status | Percentage |
|---|---|
| Children | 27% |
| Adult | 73% |
Population by Age
| Status | Percentage |
|---|---|
| 0-9 | 13% |
| 10-19 | 14% |
| 20-29 | 13% |
| 30-39 | 13% |
| 40-49 | 12% |
| 50-59 | 14% |
| 60-69 | 11% |
| 70-79 | 6% |
| 80 Above | 4% |
Males by Age Distribution
| Status | Percentage |
|---|---|
| 0-9 | 13% |
| 10-19 | 13% |
| 20-29 | 13% |
| 30-39 | 13% |
| 40-49 | 12% |
| 50-59 | 13% |
| 60-69 | 10% |
| 70-79 | 11% |
| 80 Above | 3% |
Females by Age Distribution
| Status | Percentage |
|---|---|
| 0-9 | 12% |
| 10-19 | 12% |
| 20-29 | 12% |
| 30-39 | 12% |
| 40-49 | 12% |
| 50-59 | 14% |
| 60-69 | 10% |
| 70-79 | 11% |
| 80 Above | 5% |
