
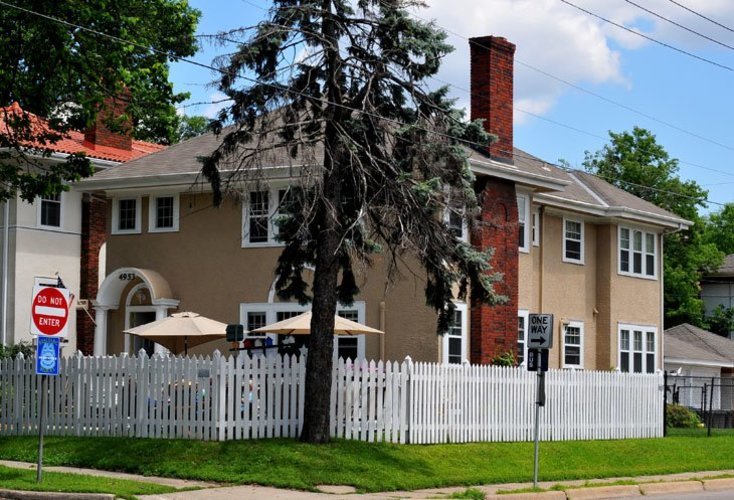
Rakhma Peace Home
$ Call for Rates
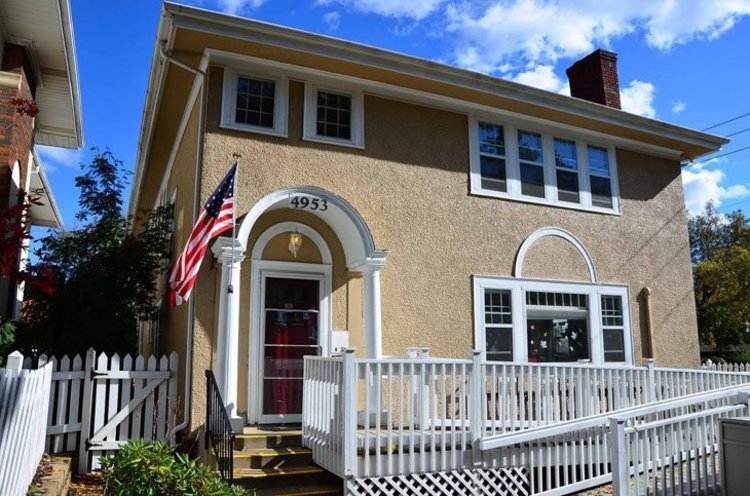
4953 Aldrich, Minneapolis, MN 55419
Overview
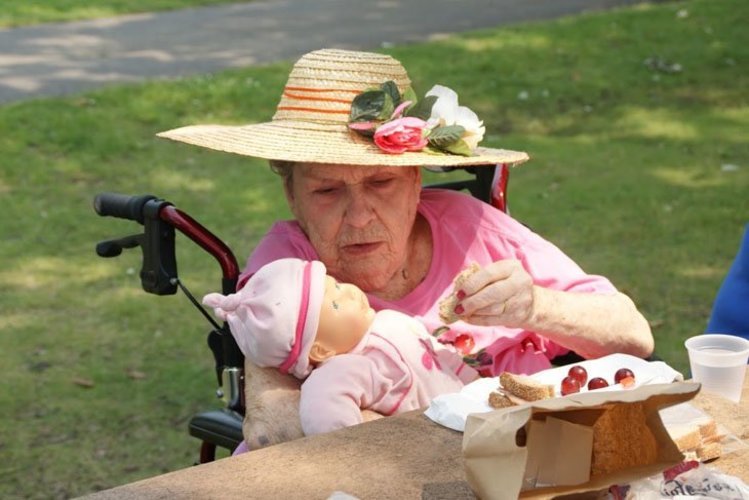
Care Types: Alzheimer’s Care
Peace Home was the first Rakhma Home that opened its doors in 1984. This early 20th-century duplex is located in southwest Minneapolis, two blocks from Minnehaha Creek and very close to the beautiful Lake Harriet, the Rose Gardens, Bird Sanctuary, and more. Across the street from the house is the Malt Shop, George and the Dragon, Patina gifts and more. The Washburn Library is only 2 blocks away and offers special lecture series that some of our residents participate in. Peace Home has capacity for 10 residents total, five in Unit I, and five in Unit II. Peace Home currently is an all-female home.
To learn more about this provider�s license and review other available state reports, please visit:
Minnesota Health Care Provider Directory
….
SHOW MORE
Amenities
- Adults 55 and over accepted
- Licensed by the State
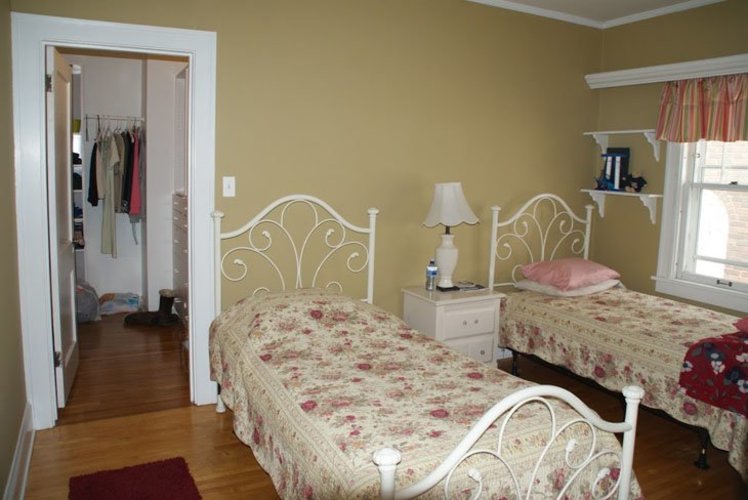
- Semi-Private Apartments/Rooms
- Some Pets Are Allowed
Contact for available floor plans
Contact for available Payment Options
Neighborhood & Demographics

DEMOGRAPHIC BREAKDOWN
32%
Single
Marital Status
52%
Married Couples
Community
78%
Drove By Themselves
Commute
3%
Below 9th Grade
Highest Level of Education
27%
Children
Adult vs. Children
13%
0-9
Population by Age
13%
0-9
Males by Age Distribution
12%
0-9
Females by Age Distribution
Males by Age Distribution
| Status | Percentage |
|---|---|
| 0-9 | 13% |
| 10-19 | 13% |
| 20-29 | 13% |
| 30-39 | 13% |
| 40-49 | 12% |
| 50-59 | 13% |
| 60-69 | 10% |
| 70-79 | 11% |
| 80 Above | 3% |
Females by Age Distribution
| Status | Percentage |
|---|---|
| 0-9 | 12% |
| 10-19 | 12% |
| 20-29 | 12% |
| 30-39 | 12% |
| 40-49 | 12% |
| 50-59 | 14% |
| 60-69 | 10% |
| 70-79 | 11% |
| 80 Above | 5% |
Marital Status
| Status | Percentage |
|---|---|
| Single | 32% |
| Married (Not Separated) | 52% |
| Separated | 1% |
| Widowed | 5% |
| Divorced | 10% |
Community
| Status | Percentage |
|---|---|
| Married Couples | 52% |
| Single Females | 10% |
| Single Males | 4% |
| Living Alone | 10% |
| Living With Family | 24% |
Commute
| Status | Percentage |
|---|---|
| Drove By Themselves | 78% |
| Public Transportation | 3% |
| Carpooled | 9% |
| Walked | 3% |
| Occasional Drive | 0% |
| Work At Home | 5% |
| Other | 2% |
Highest Level of Education
| Status | Percentage |
|---|---|
| Below 9th Grade | 3% |
| Bachelors Degree | 22% |
| High School | 26% |
| College | 22% |
| Associate Degree | 11% |
| 9th to 12th Grade | 5% |
| Graduate | 11% |
Adult vs. Children
| Status | Percentage |
|---|---|
| Children | 27% |
| Adult | 73% |
Population by Age
| Status | Percentage |
|---|---|
| 0-9 | 13% |
| 10-19 | 14% |
| 20-29 | 13% |
| 30-39 | 13% |
| 40-49 | 12% |
| 50-59 | 14% |
| 60-69 | 11% |
| 70-79 | 6% |
| 80 Above | 4% |
Males by Age Distribution
| Status | Percentage |
|---|---|
| 0-9 | 13% |
| 10-19 | 13% |
| 20-29 | 13% |
| 30-39 | 13% |
| 40-49 | 12% |
| 50-59 | 13% |
| 60-69 | 10% |
| 70-79 | 11% |
| 80 Above | 3% |
Females by Age Distribution
| Status | Percentage |
|---|---|
| 0-9 | 12% |
| 10-19 | 12% |
| 20-29 | 12% |
| 30-39 | 12% |
| 40-49 | 12% |
| 50-59 | 14% |
| 60-69 | 10% |
| 70-79 | 11% |
| 80 Above | 5% |
