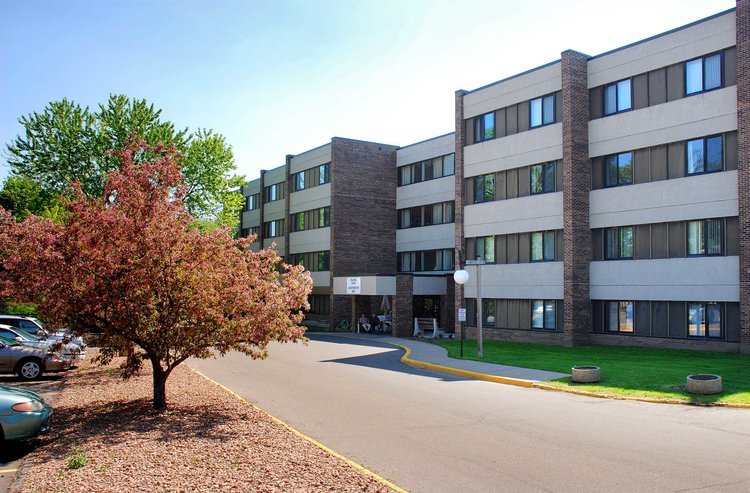
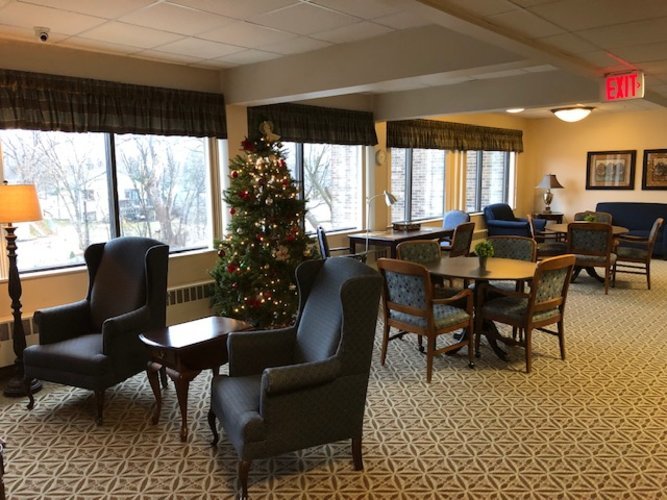
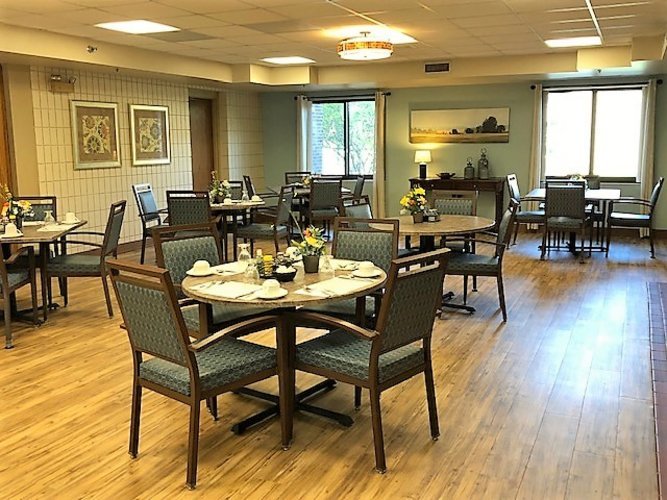
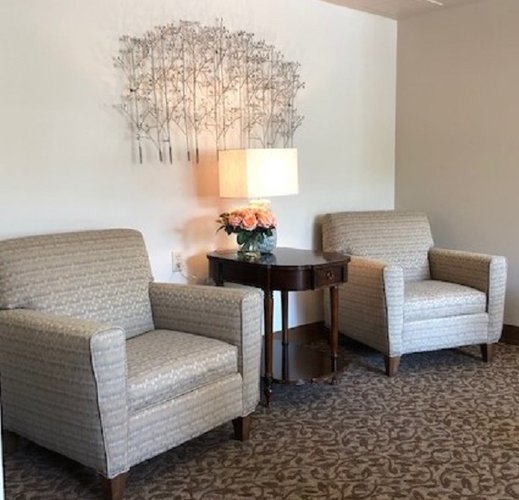
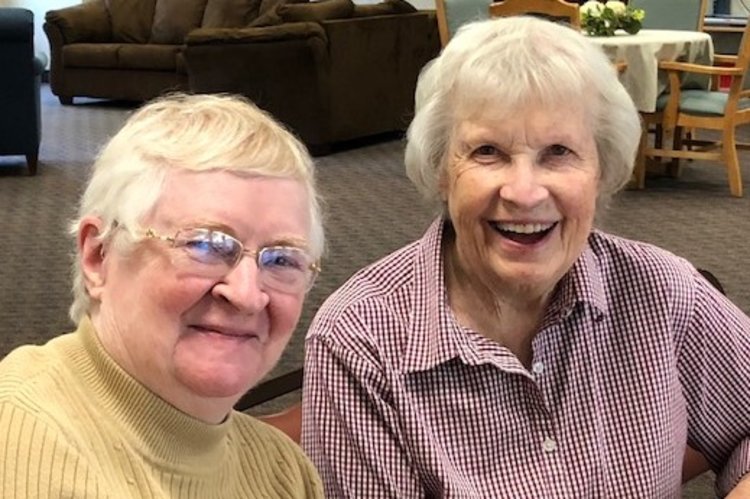
Chapel View Senior Health & Living Senior Living Community
$ Call for Rates
605 Minnetonka Mills Rd, Hopkins, MN 55343
Overview
Care Types: Assisted Living, Independent Living
Chapel View Senior Living is a wellness-focused senior living community that combines warmth and hospitality with the expertise of caring, long term staff.
….
SHOW MORE
To learn more about this provider�s license and review other available state reports, please visit:
Minnesota Health Care Provider Directory
Amenities
- 2-bedroom apartments
- Adults 55 and over accepted
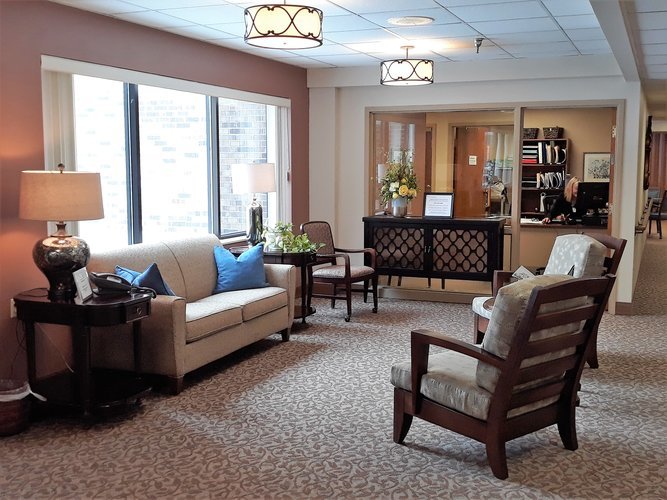
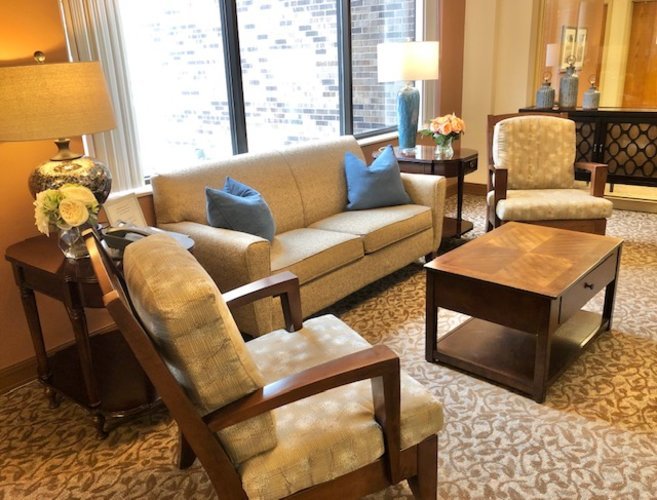
- Common Areas with TVs
- Free High-Speed WiFi access
- Free Transportation Services
- Full-size kitchen
- Housekeeping Services Available
- Community Dining Available
- Offsite Activities Available
- On-site haircuts/barber services
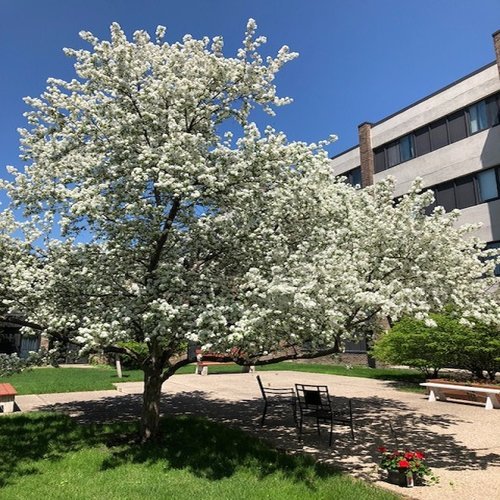
- Outdoor Patios and Gardens
- Licensed by the State
- Single Room Units Available
- Some Pets Are Allowed
- Studio Apartments Available
Contact for available floor plans
Contact for available Payment Options
Neighborhood & Demographics
10 closest amenities
Show Map Show List
10 closest amenities
Grocery stores
Coffee shops
Gas Stations
Restaurants
Pharmacies
Financial services
DEMOGRAPHIC BREAKDOWN
32%
Single
Marital Status
52%
Married Couples
Community
78%
Drove By Themselves
Commute
3%
Below 9th Grade
Highest Level of Education
27%
Children
Adult vs. Children
13%
0-9
Population by Age
13%
0-9
Males by Age Distribution
12%
0-9
Females by Age Distribution
Males by Age Distribution
Status | Percentage |
---|---|
0-9 | 13% |
10-19 | 13% |
20-29 | 13% |
30-39 | 13% |
40-49 | 12% |
50-59 | 13% |
60-69 | 10% |
70-79 | 11% |
80 Above | 3% |
Females by Age Distribution
Status | Percentage |
---|---|
0-9 | 12% |
10-19 | 12% |
20-29 | 12% |
30-39 | 12% |
40-49 | 12% |
50-59 | 14% |
60-69 | 10% |
70-79 | 11% |
80 Above | 5% |
Marital Status
Status | Percentage |
---|---|
Single | 32% |
Married (Not Separated) | 52% |
Separated | 1% |
Widowed | 5% |
Divorced | 10% |
Community
Status | Percentage |
---|---|
Married Couples | 52% |
Single Females | 10% |
Single Males | 4% |
Living Alone | 10% |
Living With Family | 24% |
Commute
Status | Percentage |
---|---|
Drove By Themselves | 78% |
Public Transportation | 3% |
Carpooled | 9% |
Walked | 3% |
Occasional Drive | 0% |
Work At Home | 5% |
Other | 2% |
Highest Level of Education
Status | Percentage |
---|---|
Below 9th Grade | 3% |
Bachelors Degree | 22% |
High School | 26% |
College | 22% |
Associate Degree | 11% |
9th to 12th Grade | 5% |
Graduate | 11% |
Adult vs. Children
Status | Percentage |
---|---|
Children | 27% |
Adult | 73% |
Population by Age
Status | Percentage |
---|---|
0-9 | 13% |
10-19 | 14% |
20-29 | 13% |
30-39 | 13% |
40-49 | 12% |
50-59 | 14% |
60-69 | 11% |
70-79 | 6% |
80 Above | 4% |
Males by Age Distribution
Status | Percentage |
---|---|
0-9 | 13% |
10-19 | 13% |
20-29 | 13% |
30-39 | 13% |
40-49 | 12% |
50-59 | 13% |
60-69 | 10% |
70-79 | 11% |
80 Above | 3% |
Females by Age Distribution
Status | Percentage |
---|---|
0-9 | 12% |
10-19 | 12% |
20-29 | 12% |
30-39 | 12% |
40-49 | 12% |
50-59 | 14% |
60-69 | 10% |
70-79 | 11% |
80 Above | 5% |