

34.1596
-118.37
Driving Directions
Street View
Photos
Map
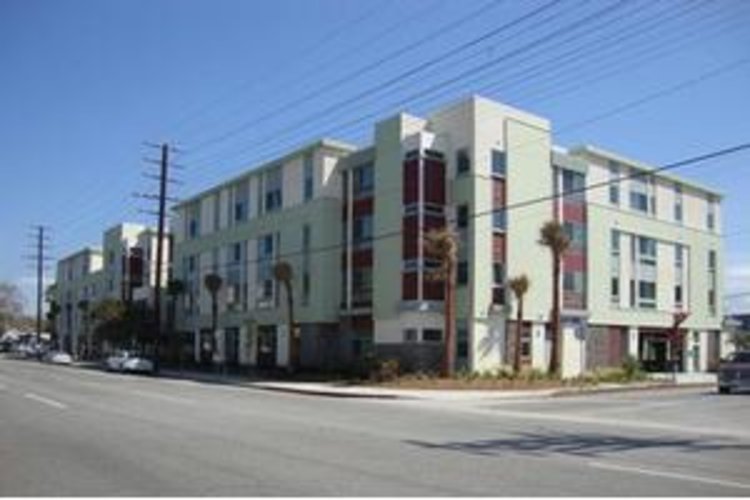
Vineland Avenue Senior Housing
$ Call for Rates
4900 Vineland Ave, North Hollywood, CA 91601
Overview
Care Types: Low Income-Affordable
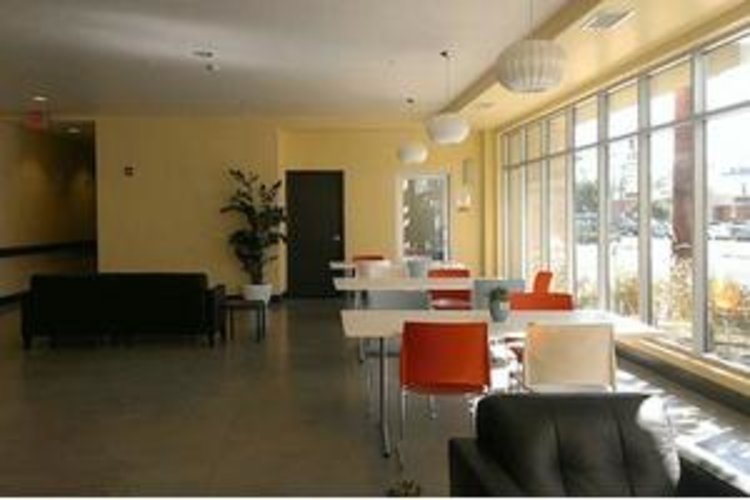
Vineland Avenue Senior Housing The building contains 82 affordable one-bedroom apartments with a ground floor community room and second and fourth floor landscaped outdoor patios. Located near many neighborhood services and retail establishments, the location offers easy transit access to parks, senior services, a public library, medical offices, and is only one bus stop away from the MTA’s Redline subway.
Contact for available floor plans
Contact for available Payment Options
Neighborhood & Demographics
10 closest amenities
Show Map Show List
10 closest amenities
Grocery stores
Coffee shops
Gas Stations
Restaurants
Pharmacies
Financial services
Powered by 
DEMOGRAPHIC BREAKDOWN
37%
Single
Marital Status
48%
Married Couples
Community
73%
Drove By Themselves
Commute
10%
Below 9th Grade
Highest Level of Education
28%
Children
Adult vs. Children
13%
0-9
Population by Age
13%
0-9
Males by Age Distribution
12%
0-9
Females by Age Distribution
Males by Age Distribution
| Status | Percentage |
|---|---|
| 0-9 | 13% |
| 10-19 | 13% |
| 20-29 | 15% |
| 30-39 | 13% |
| 40-49 | 13% |
| 50-59 | 12% |
| 60-69 | 9% |
| 70-79 | 10% |
| 80 Above | 3% |
Females by Age Distribution
| Status | Percentage |
|---|---|
| 0-9 | 12% |
| 10-19 | 12% |
| 20-29 | 14% |
| 30-39 | 13% |
| 40-49 | 13% |
| 50-59 | 13% |
| 60-69 | 10% |
| 70-79 | 10% |
| 80 Above | 4% |
Marital Status
| Status | Percentage |
|---|---|
| Single | 37% |
| Married (Not Separated) | 46% |
| Separated | 2% |
| Widowed | 5% |
| Divorced | 10% |
Community
| Status | Percentage |
|---|---|
| Married Couples | 48% |
| Single Females | 13% |
| Single Males | 6% |
| Living Alone | 8% |
| Living With Family | 25% |
Commute
| Status | Percentage |
|---|---|
| Drove By Themselves | 73% |
| Public Transportation | 5% |
| Carpooled | 11% |
| Walked | 3% |
| Occasional Drive | 0% |
| Work At Home | 5% |
| Other | 2% |
Highest Level of Education
| Status | Percentage |
|---|---|
| Below 9th Grade | 10% |
| Bachelors Degree | 20% |
| High School | 21% |
| College | 22% |
| Associate Degree | 8% |
| 9th to 12th Grade | 8% |
| Graduate | 11% |
Adult vs. Children
| Status | Percentage |
|---|---|
| Children | 28% |
| Adult | 72% |
Population by Age
| Status | Percentage |
|---|---|
| 0-9 | 13% |
| 10-19 | 14% |
| 20-29 | 14% |
| 30-39 | 14% |
| 40-49 | 13% |
| 50-59 | 13% |
| 60-69 | 10% |
| 70-79 | 5% |
| 80 Above | 3% |
Males by Age Distribution
| Status | Percentage |
|---|---|
| 0-9 | 13% |
| 10-19 | 13% |
| 20-29 | 15% |
| 30-39 | 13% |
| 40-49 | 13% |
| 50-59 | 12% |
| 60-69 | 9% |
| 70-79 | 10% |
| 80 Above | 3% |
Females by Age Distribution
| Status | Percentage |
|---|---|
| 0-9 | 12% |
| 10-19 | 12% |
| 20-29 | 14% |
| 30-39 | 13% |
| 40-49 | 13% |
| 50-59 | 13% |
| 60-69 | 10% |
| 70-79 | 10% |
| 80 Above | 4% |
