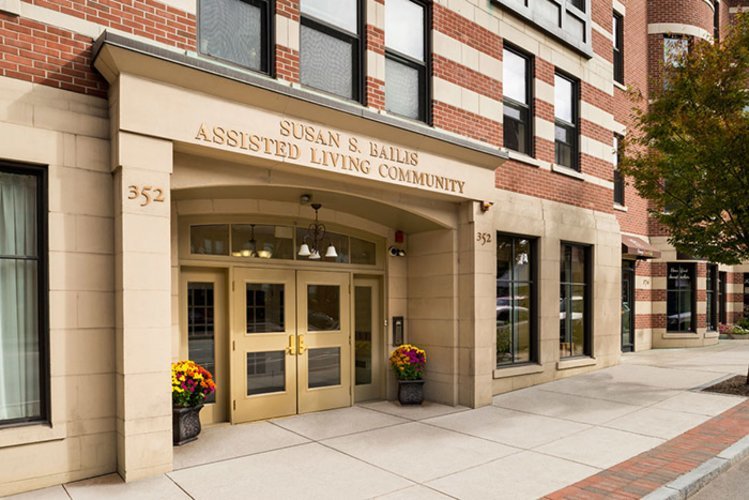
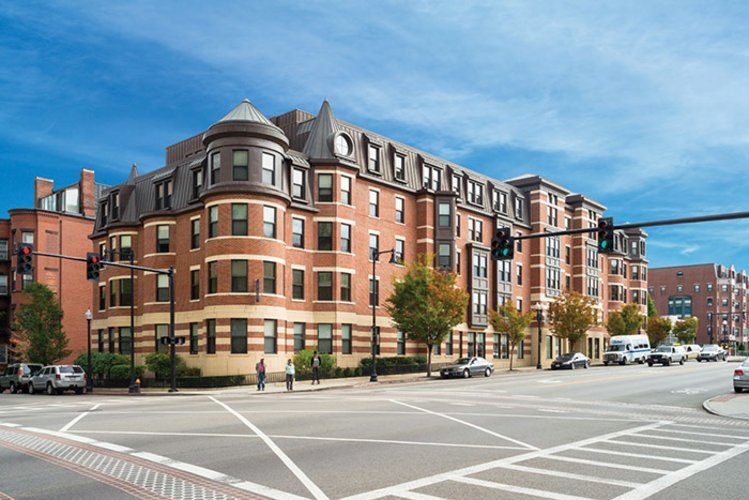
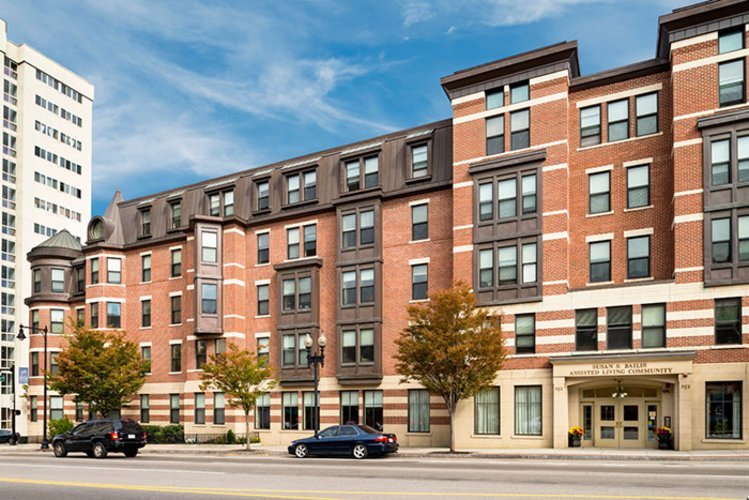


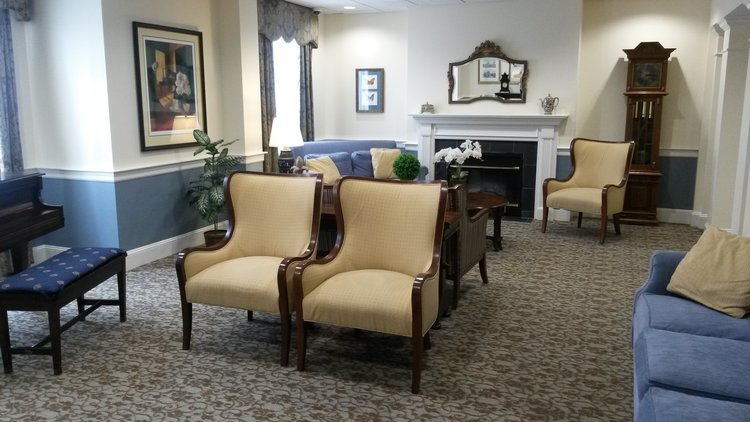
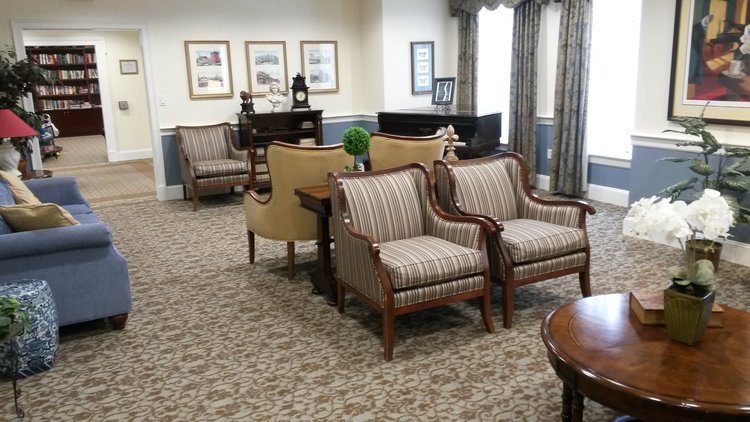
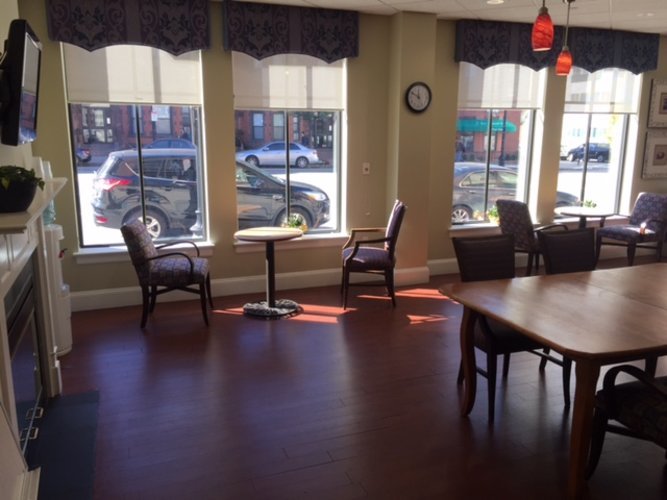
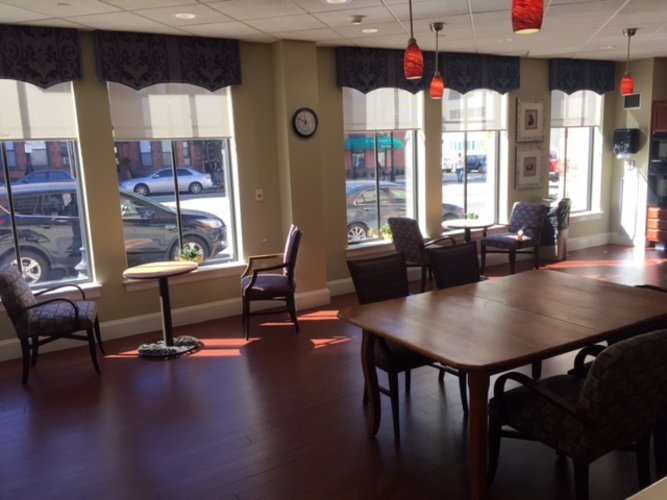
Susan Bailis Assisted Living
$ Call for Rates
352 Massachusetts Avenue, Boston, MA 02115
Overview
Care Types: Assisted Living
The majority of our Care and Management Teams has been here for over 5 years. We have regular performances by N.E Conservatory and Berklee College of Music students. MBTA station is across the street.
….
SHOW MORE
To learn more about this provider’s license and review other available state reports, please visit:
Massachusetts Division of Health Care Facility Licensure and Certification
Amenities
- Adults 55 and over accepted
- English Language
- Guests Allowed at Meal Time
- Housekeeping Services Available
- In-house Laundry and Drycleaning
- In-house Skilled Nursing
- Kitchenette in resident rooms
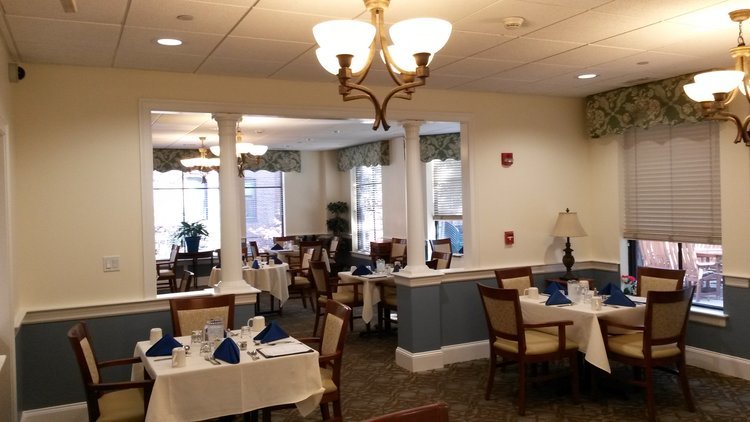
- Community Dining Available
- Medication Administration
- Laundry Services for Linens
- Offsite Activities Available
- On-site haircuts/barber services
- On-site Resident Parking
- Outdoor Patios and Gardens
- Physical Therapist Services
- Recreation room
- Licensed by the State
- Single Room Units Available
- Skilled nursing services
- Studio Apartments Available
Contact for available floor plans
Contact for available Payment Options
Neighborhood & Demographics

DEMOGRAPHIC BREAKDOWN
37%
Single
Marital Status
46%
Married Couples
Community
72%
Drove By Themselves
Commute
5%
Below 9th Grade
Highest Level of Education
25%
Children
Adult vs. Children
11%
0-9
Population by Age
11%
0-9
Males by Age Distribution
10%
0-9
Females by Age Distribution
Males by Age Distribution
| Status | Percentage |
|---|---|
| 0-9 | 11% |
| 10-19 | 12% |
| 20-29 | 14% |
| 30-39 | 12% |
| 40-49 | 12% |
| 50-59 | 14% |
| 60-69 | 10% |
| 70-79 | 12% |
| 80 Above | 3% |
Females by Age Distribution
| Status | Percentage |
|---|---|
| 0-9 | 10% |
| 10-19 | 11% |
| 20-29 | 13% |
| 30-39 | 12% |
| 40-49 | 12% |
| 50-59 | 14% |
| 60-69 | 11% |
| 70-79 | 11% |
| 80 Above | 5% |
Marital Status
| Status | Percentage |
|---|---|
| Single | 37% |
| Married (Not Separated) | 46% |
| Separated | 2% |
| Widowed | 6% |
| Divorced | 10% |
Community
| Status | Percentage |
|---|---|
| Married Couples | 46% |
| Single Females | 12% |
| Single Males | 4% |
| Living Alone | 11% |
| Living With Family | 26% |
Commute
| Status | Percentage |
|---|---|
| Drove By Themselves | 72% |
| Public Transportation | 9% |
| Carpooled | 8% |
| Walked | 5% |
| Occasional Drive | 0% |
| Work At Home | 4% |
| Other | 2% |
Highest Level of Education
| Status | Percentage |
|---|---|
| Below 9th Grade | 5% |
| Bachelors Degree | 23% |
| High School | 26% |
| College | 16% |
| Associate Degree | 8% |
| 9th to 12th Grade | 6% |
| Graduate | 17% |
Adult vs. Children
| Status | Percentage |
|---|---|
| Children | 25% |
| Adult | 75% |
Population by Age
| Status | Percentage |
|---|---|
| 0-9 | 11% |
| 10-19 | 13% |
| 20-29 | 14% |
| 30-39 | 13% |
| 40-49 | 13% |
| 50-59 | 15% |
| 60-69 | 11% |
| 70-79 | 6% |
| 80 Above | 4% |
Males by Age Distribution
| Status | Percentage |
|---|---|
| 0-9 | 11% |
| 10-19 | 12% |
| 20-29 | 14% |
| 30-39 | 12% |
| 40-49 | 12% |
| 50-59 | 14% |
| 60-69 | 10% |
| 70-79 | 12% |
| 80 Above | 3% |
Females by Age Distribution
| Status | Percentage |
|---|---|
| 0-9 | 10% |
| 10-19 | 11% |
| 20-29 | 13% |
| 30-39 | 12% |
| 40-49 | 12% |
| 50-59 | 14% |
| 60-69 | 11% |
| 70-79 | 11% |
| 80 Above | 5% |
