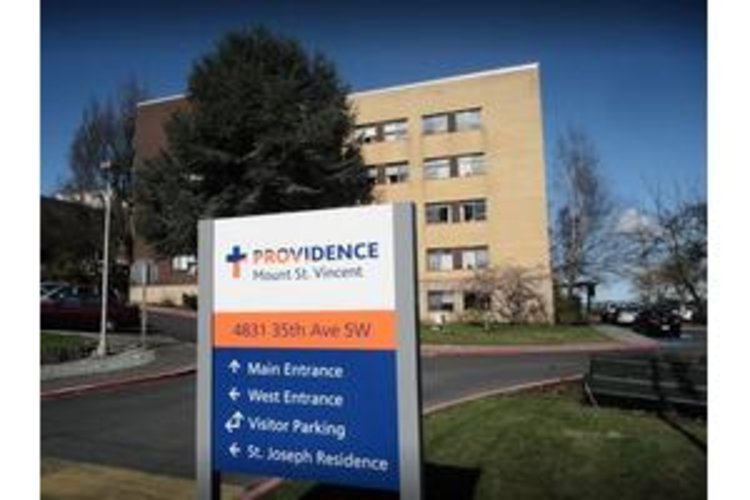
Providence Mount St. Vincent – Seattle
$ Call for Rates
4831 35th Ave SW, Seattle, WA 98126
Overview
Care Types: Assisted Living, Nursing Care, Retirement
Providence Mount St. Vincent is in the Fairmount Park neighborhood of West Seattle, located across from the West Seattle Golf Course. This retirement community is conveniently close to commercial establishments and also minutes from Seattle VA Medical Center, Harborview Medical Center, First Hill Medical Swedish Hospital and Virginia Mason Medical Center.
Contact for available floor plans
Contact for available Payment Options
DEMOGRAPHIC BREAKDOWN
31%
Single
Marital Status
51%
Married Couples
Community
73%
Drove By Themselves
Commute
4%
Below 9th Grade
Highest Level of Education
26%
Children
Adult vs. Children
13%
0-9
Population by Age
12%
0-9
Males by Age Distribution
12%
0-9
Females by Age Distribution
Males by Age Distribution
Status | Percentage |
---|---|
0-9 | 12% |
10-19 | 12% |
20-29 | 14% |
30-39 | 13% |
40-49 | 12% |
50-59 | 13% |
60-69 | 10% |
70-79 | 11% |
80 Above | 2% |
Females by Age Distribution
Status | Percentage |
---|---|
0-9 | 12% |
10-19 | 11% |
20-29 | 13% |
30-39 | 13% |
40-49 | 12% |
50-59 | 13% |
60-69 | 11% |
70-79 | 11% |
80 Above | 4% |
Marital Status
Status | Percentage |
---|---|
Single | 31% |
Married (Not Separated) | 50% |
Separated | 2% |
Widowed | 5% |
Divorced | 12% |
Community
Status | Percentage |
---|---|
Married Couples | 51% |
Single Females | 11% |
Single Males | 5% |
Living Alone | 10% |
Living With Family | 25% |
Commute
Status | Percentage |
---|---|
Drove By Themselves | 73% |
Public Transportation | 6% |
Carpooled | 10% |
Walked | 3% |
Occasional Drive | 0% |
Work At Home | 5% |
Other | 2% |
Highest Level of Education
Status | Percentage |
---|---|
Below 9th Grade | 4% |
Bachelors Degree | 21% |
High School | 23% |
College | 25% |
Associate Degree | 10% |
9th to 12th Grade | 6% |
Graduate | 12% |
Adult vs. Children
Status | Percentage |
---|---|
Children | 26% |
Adult | 74% |
Population by Age
Status | Percentage |
---|---|
0-9 | 13% |
10-19 | 13% |
20-29 | 14% |
30-39 | 14% |
40-49 | 13% |
50-59 | 14% |
60-69 | 11% |
70-79 | 6% |
80 Above | 3% |
Males by Age Distribution
Status | Percentage |
---|---|
0-9 | 12% |
10-19 | 12% |
20-29 | 14% |
30-39 | 13% |
40-49 | 12% |
50-59 | 13% |
60-69 | 10% |
70-79 | 11% |
80 Above | 2% |
Females by Age Distribution
Status | Percentage |
---|---|
0-9 | 12% |
10-19 | 11% |
20-29 | 13% |
30-39 | 13% |
40-49 | 12% |
50-59 | 13% |
60-69 | 11% |
70-79 | 11% |
80 Above | 4% |