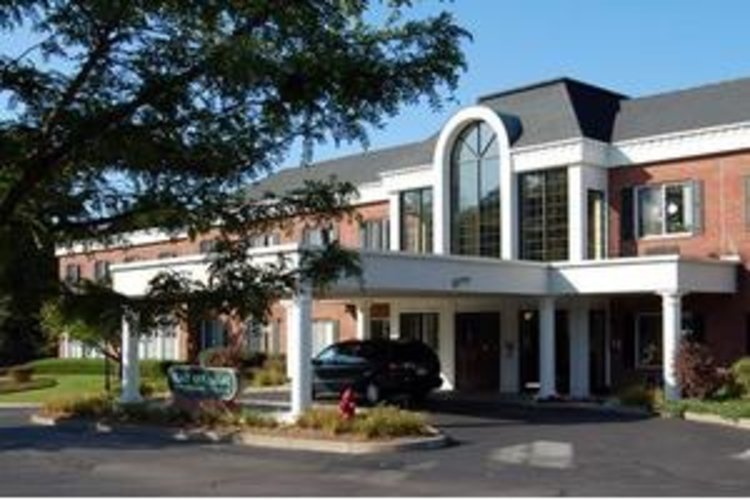
Mary Ann Morse Nursing & Rehabilitation
$ Call for Rates
45 Union Street, Natick, MA 01760
Overview
Care Types: Nursing Care
Located in a quiet, wooded setting, Mary Ann Morse Nursing & Rehabilitation is convenient to major thoroughfares and retail centers. Dozens of pharmacies and physicians’ offices are a short distance away, and MetroWest Medical Center is 15 minutes away.
Mary Ann Morse Nursing & Rehabilitation provides seniors with compassionate, patient-centered medical and non-medical services. Therapeutic supports, such as physical, occupational and speech therapy, help residents reach their physical, cognitive and emotional goals. This community also provides memory, respite and hospice care. The highly professional medical, nursing and care staff are friendly and treat residents with dignity. …. SHOW MORE
On-site activities encourage socialization and enhance cognitive skills. Outdoor amenities include a patio, deck and shaded courtyard where seniors can relax in the fresh air. Delicious meals are served restaurant-style in a spacious dining room. A small library and beauty salon are located on-site for seniors’ use.
SHOW LESSContact for available floor plans
Contact for available Payment Options
Neighborhood & Demographics

DEMOGRAPHIC BREAKDOWN
37%
Single
Marital Status
46%
Married Couples
Community
72%
Drove By Themselves
Commute
5%
Below 9th Grade
Highest Level of Education
25%
Children
Adult vs. Children
11%
0-9
Population by Age
11%
0-9
Males by Age Distribution
10%
0-9
Females by Age Distribution
Males by Age Distribution
| Status | Percentage |
|---|---|
| 0-9 | 11% |
| 10-19 | 12% |
| 20-29 | 14% |
| 30-39 | 12% |
| 40-49 | 12% |
| 50-59 | 14% |
| 60-69 | 10% |
| 70-79 | 12% |
| 80 Above | 3% |
Females by Age Distribution
| Status | Percentage |
|---|---|
| 0-9 | 10% |
| 10-19 | 11% |
| 20-29 | 13% |
| 30-39 | 12% |
| 40-49 | 12% |
| 50-59 | 14% |
| 60-69 | 11% |
| 70-79 | 11% |
| 80 Above | 5% |
Marital Status
| Status | Percentage |
|---|---|
| Single | 37% |
| Married (Not Separated) | 46% |
| Separated | 2% |
| Widowed | 6% |
| Divorced | 10% |
Community
| Status | Percentage |
|---|---|
| Married Couples | 46% |
| Single Females | 12% |
| Single Males | 4% |
| Living Alone | 11% |
| Living With Family | 26% |
Commute
| Status | Percentage |
|---|---|
| Drove By Themselves | 72% |
| Public Transportation | 9% |
| Carpooled | 8% |
| Walked | 5% |
| Occasional Drive | 0% |
| Work At Home | 4% |
| Other | 2% |
Highest Level of Education
| Status | Percentage |
|---|---|
| Below 9th Grade | 5% |
| Bachelors Degree | 23% |
| High School | 26% |
| College | 16% |
| Associate Degree | 8% |
| 9th to 12th Grade | 6% |
| Graduate | 17% |
Adult vs. Children
| Status | Percentage |
|---|---|
| Children | 25% |
| Adult | 75% |
Population by Age
| Status | Percentage |
|---|---|
| 0-9 | 11% |
| 10-19 | 13% |
| 20-29 | 14% |
| 30-39 | 13% |
| 40-49 | 13% |
| 50-59 | 15% |
| 60-69 | 11% |
| 70-79 | 6% |
| 80 Above | 4% |
Males by Age Distribution
| Status | Percentage |
|---|---|
| 0-9 | 11% |
| 10-19 | 12% |
| 20-29 | 14% |
| 30-39 | 12% |
| 40-49 | 12% |
| 50-59 | 14% |
| 60-69 | 10% |
| 70-79 | 12% |
| 80 Above | 3% |
Females by Age Distribution
| Status | Percentage |
|---|---|
| 0-9 | 10% |
| 10-19 | 11% |
| 20-29 | 13% |
| 30-39 | 12% |
| 40-49 | 12% |
| 50-59 | 14% |
| 60-69 | 11% |
| 70-79 | 11% |
| 80 Above | 5% |
