39.891
-80.1441
Golden Livingcenter – Waynesburg
$ Call for Rates
300 CENTER AVENUE, Waynesburg, PA 15370
$ Call for Rates
300 CENTER AVENUE, Waynesburg, PA 15370
Care Types: Nursing Care, Memory Care, Assisted Living
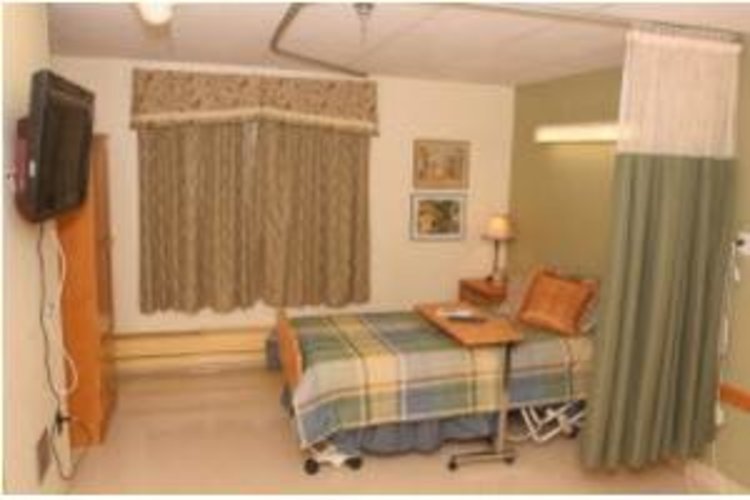
Golden Living Center, Waynesburg, is an adult care community located in Waynesburg, Pennsylvania, that provides a medically and emotionally supportive environment for seniors. This community is near the Greene County Airport and Rohanna’s Golf Course as well as several supermarkets, restaurants and community parks.
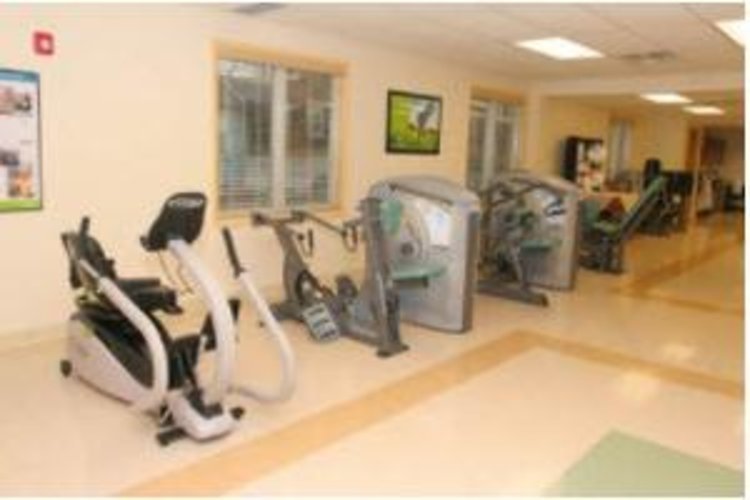
Golden Living Center, Waynesburg, offers nursing assistance to residents who need help caring for themselves, whether that’s help with eating, bathing, getting around or various other needs. This community provides pharmaceutical assistance, oxygen assistance and medication management services. It offers speech, occupational and radiation therapy, and caregivers conduct monthly wellness checks for each resident. Specialized memory care is available as well. …. SHOW MORE
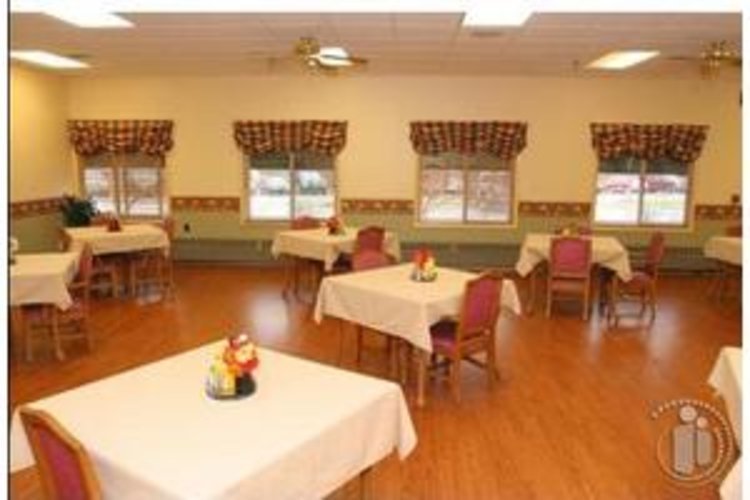
Residents receive three meals a day that can be adjusted for their dietary needs or health conditions such as diabetes and high blood pressure. Management organizes community activities such as board games, music activities and pet therapy that offer opportunities to relax and socialize, and there are outdoor spaces for residents to enjoy as well. Transportation is available for medical appointments, religious services or shopping needs.
SHOW LESS
34%
Single
Marital Status
46%
Married Couples
Community
77%
Drove By Themselves
Commute
4%
Below 9th Grade
Highest Level of Education
25%
Children
Adult vs. Children
11%
0-9
Population by Age
11%
0-9
Males by Age Distribution
10%
0-9
Females by Age Distribution
| Status | Percentage |
|---|---|
| 0-9 | 11% |
| 10-19 | 12% |
| 20-29 | 13% |
| 30-39 | 11% |
| 40-49 | 12% |
| 50-59 | 14% |
| 60-69 | 11% |
| 70-79 | 13% |
| 80 Above | 3% |
| Status | Percentage |
|---|---|
| 0-9 | 10% |
| 10-19 | 11% |
| 20-29 | 12% |
| 30-39 | 11% |
| 40-49 | 12% |
| 50-59 | 14% |
| 60-69 | 12% |
| 70-79 | 13% |
| 80 Above | 6% |
| Status | Percentage |
|---|---|
| Single | 34% |
| Married (Not Separated) | 48% |
| Separated | 2% |
| Widowed | 7% |
| Divorced | 10% |
| Status | Percentage |
|---|---|
| Married Couples | 46% |
| Single Females | 11% |
| Single Males | 4% |
| Living Alone | 11% |
| Living With Family | 27% |
| Status | Percentage |
|---|---|
| Drove By Themselves | 77% |
| Public Transportation | 5% |
| Carpooled | 9% |
| Walked | 4% |
| Occasional Drive | 0% |
| Work At Home | 4% |
| Other | 1% |
| Status | Percentage |
|---|---|
| Below 9th Grade | 4% |
| Bachelors Degree | 17% |
| High School | 37% |
| College | 16% |
| Associate Degree | 8% |
| 9th to 12th Grade | 7% |
| Graduate | 11% |
| Status | Percentage |
|---|---|
| Children | 25% |
| Adult | 75% |
| Status | Percentage |
|---|---|
| 0-9 | 11% |
| 10-19 | 13% |
| 20-29 | 13% |
| 30-39 | 12% |
| 40-49 | 13% |
| 50-59 | 15% |
| 60-69 | 12% |
| 70-79 | 7% |
| 80 Above | 5% |
| Status | Percentage |
|---|---|
| 0-9 | 11% |
| 10-19 | 12% |
| 20-29 | 13% |
| 30-39 | 11% |
| 40-49 | 12% |
| 50-59 | 14% |
| 60-69 | 11% |
| 70-79 | 13% |
| 80 Above | 3% |
| Status | Percentage |
|---|---|
| 0-9 | 10% |
| 10-19 | 11% |
| 20-29 | 12% |
| 30-39 | 11% |
| 40-49 | 12% |
| 50-59 | 14% |
| 60-69 | 12% |
| 70-79 | 13% |
| 80 Above | 6% |
By clicking “Request Info” you agree to our Terms of Use and Privacy Policy. You also consent to receive texts and calls, which may be autodialed, from us and our partner providers; however, your consent is not a condition to using our service.

By clicking “Request Info”, you agree to our Terms of Use, our Privacy Policy, and our Agreement to be Contacted by Telephone. You also consent that we, or our partner providers, may reach out to you about senior living solutions or Medicare insurance using a system that can auto-dial; however, you do not need to consent to this to use our service.