44.1688
-73.2523
Vergennes Residential Care, Inc
$ Call for Rates
34 North Street, Vergennes, VT 05491
$ Call for Rates
34 North Street, Vergennes, VT 05491
Care Types: Assisted Living, Nursing Care, Retirement
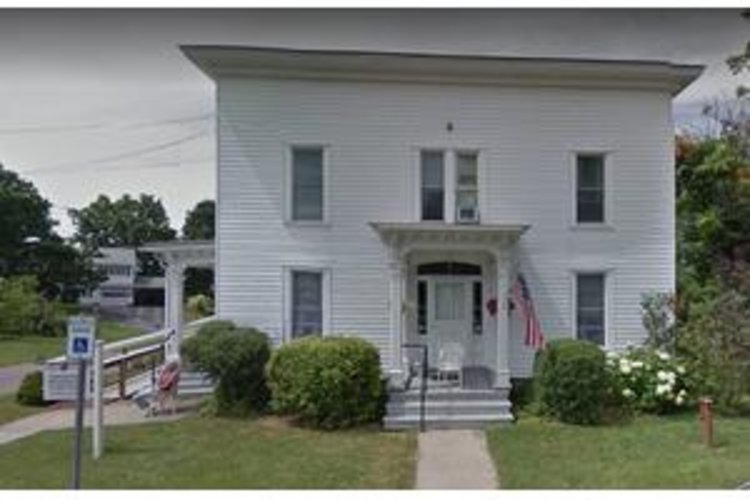
Vergennes Residential Care is located in the quiet neighborhood of Vergennes, Vermont, in sight of Otter Creek and the surrounding MacDonough Park. It’s a short distance from the restaurants and shops on Ethan Allen Highway. For residents who need emergency or acute care, Porter Medical Center is less than 15 miles south of this facility.
Vergennes Residential Care has a five-decade history of providing assisted living and other care services. The facility provides 24-hour staffing, personal care services such as grooming and bathing, laundry, housekeeping, and three daily meals along with snacks. Residents at this home typically need a moderate to high level of care, including assistance with several activities of daily living. …. SHOW MORE
The Victorian home offers an intimate environment with just 18 beds, including both private and semiprivate rooms. Residents at this care home can take part in daily activities and use transportation services to get around town. Other amenities at Vergennes include the common dining room, living room, TV room, porch and gardens. Rooms have wireless internet and private phone lines.
SHOW LESS
32%
Single
Marital Status
49%
Married Couples
Community
75%
Drove By Themselves
Commute
3%
Below 9th Grade
Highest Level of Education
24%
Children
Adult vs. Children
10%
0-9
Population by Age
10%
0-9
Males by Age Distribution
9%
0-9
Females by Age Distribution
| Status | Percentage |
|---|---|
| 0-9 | 10% |
| 10-19 | 13% |
| 20-29 | 12% |
| 30-39 | 11% |
| 40-49 | 11% |
| 50-59 | 14% |
| 60-69 | 13% |
| 70-79 | 13% |
| 80 Above | 3% |
| Status | Percentage |
|---|---|
| 0-9 | 9% |
| 10-19 | 11% |
| 20-29 | 12% |
| 30-39 | 11% |
| 40-49 | 11% |
| 50-59 | 15% |
| 60-69 | 13% |
| 70-79 | 12% |
| 80 Above | 5% |
| Status | Percentage |
|---|---|
| Single | 32% |
| Married (Not Separated) | 49% |
| Separated | 1% |
| Widowed | 6% |
| Divorced | 13% |
| Status | Percentage |
|---|---|
| Married Couples | 49% |
| Single Females | 9% |
| Single Males | 4% |
| Living Alone | 11% |
| Living With Family | 27% |
| Status | Percentage |
|---|---|
| Drove By Themselves | 75% |
| Public Transportation | 1% |
| Carpooled | 10% |
| Walked | 6% |
| Occasional Drive | 0% |
| Work At Home | 7% |
| Other | 2% |
| Status | Percentage |
|---|---|
| Below 9th Grade | 3% |
| Bachelors Degree | 21% |
| High School | 31% |
| College | 17% |
| Associate Degree | 8% |
| 9th to 12th Grade | 5% |
| Graduate | 14% |
| Status | Percentage |
|---|---|
| Children | 24% |
| Adult | 76% |
| Status | Percentage |
|---|---|
| 0-9 | 10% |
| 10-19 | 14% |
| 20-29 | 12% |
| 30-39 | 12% |
| 40-49 | 12% |
| 50-59 | 16% |
| 60-69 | 14% |
| 70-79 | 7% |
| 80 Above | 5% |
| Status | Percentage |
|---|---|
| 0-9 | 10% |
| 10-19 | 13% |
| 20-29 | 12% |
| 30-39 | 11% |
| 40-49 | 11% |
| 50-59 | 14% |
| 60-69 | 13% |
| 70-79 | 13% |
| 80 Above | 3% |
| Status | Percentage |
|---|---|
| 0-9 | 9% |
| 10-19 | 11% |
| 20-29 | 12% |
| 30-39 | 11% |
| 40-49 | 11% |
| 50-59 | 15% |
| 60-69 | 13% |
| 70-79 | 12% |
| 80 Above | 5% |
By clicking “Request Info” you agree to our Terms of Use and Privacy Policy. You also consent to receive texts and calls, which may be autodialed, from us and our partner providers; however, your consent is not a condition to using our service.

By clicking “Request Info”, you agree to our Terms of Use, our Privacy Policy, and our Agreement to be Contacted by Telephone. You also consent that we, or our partner providers, may reach out to you about senior living solutions or Medicare insurance using a system that can auto-dial; however, you do not need to consent to this to use our service.