45.6314
-122.675
Driving Directions
Street View
Photos
Map
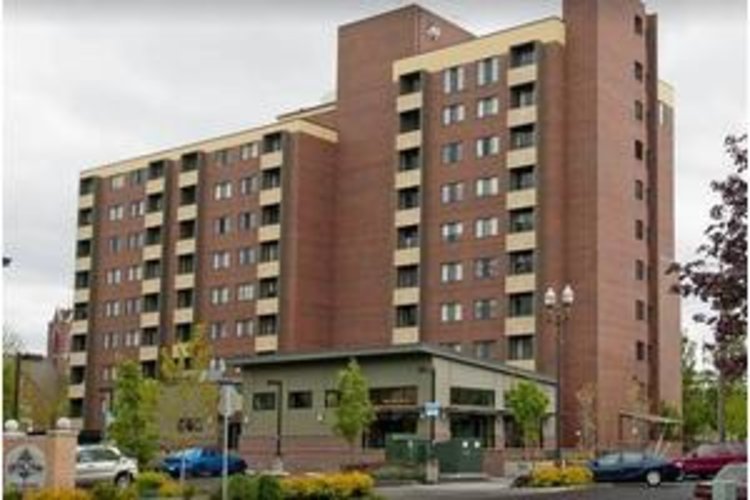
Van Vista
$ Call for Rates
410 W 13th St, Vancouver, WA 98660
Overview
To learn more about this provider�s license and review other available state reports, please visit:
Washington State Department of Social and Health Services Long-Term Care Residential Options
….
SHOW MORE
Contact for available floor plans
Contact for available Payment Options
Neighborhood & Demographics
10 closest amenities
Show Map Show List
10 closest amenities
Grocery stores
Coffee shops
Gas Stations
Restaurants
Pharmacies
Financial services
Powered by 
DEMOGRAPHIC BREAKDOWN
31%
Single
Marital Status
51%
Married Couples
Community
73%
Drove By Themselves
Commute
4%
Below 9th Grade
Highest Level of Education
26%
Children
Adult vs. Children
13%
0-9
Population by Age
12%
0-9
Males by Age Distribution
12%
0-9
Females by Age Distribution
Males by Age Distribution
| Status | Percentage |
|---|---|
| 0-9 | 12% |
| 10-19 | 12% |
| 20-29 | 14% |
| 30-39 | 13% |
| 40-49 | 12% |
| 50-59 | 13% |
| 60-69 | 10% |
| 70-79 | 11% |
| 80 Above | 2% |
Females by Age Distribution
| Status | Percentage |
|---|---|
| 0-9 | 12% |
| 10-19 | 11% |
| 20-29 | 13% |
| 30-39 | 13% |
| 40-49 | 12% |
| 50-59 | 13% |
| 60-69 | 11% |
| 70-79 | 11% |
| 80 Above | 4% |
Marital Status
| Status | Percentage |
|---|---|
| Single | 31% |
| Married (Not Separated) | 50% |
| Separated | 2% |
| Widowed | 5% |
| Divorced | 12% |
Community
| Status | Percentage |
|---|---|
| Married Couples | 51% |
| Single Females | 11% |
| Single Males | 5% |
| Living Alone | 10% |
| Living With Family | 25% |
Commute
| Status | Percentage |
|---|---|
| Drove By Themselves | 73% |
| Public Transportation | 6% |
| Carpooled | 10% |
| Walked | 3% |
| Occasional Drive | 0% |
| Work At Home | 5% |
| Other | 2% |
Highest Level of Education
| Status | Percentage |
|---|---|
| Below 9th Grade | 4% |
| Bachelors Degree | 21% |
| High School | 23% |
| College | 25% |
| Associate Degree | 10% |
| 9th to 12th Grade | 6% |
| Graduate | 12% |
Adult vs. Children
| Status | Percentage |
|---|---|
| Children | 26% |
| Adult | 74% |
Population by Age
| Status | Percentage |
|---|---|
| 0-9 | 13% |
| 10-19 | 13% |
| 20-29 | 14% |
| 30-39 | 14% |
| 40-49 | 13% |
| 50-59 | 14% |
| 60-69 | 11% |
| 70-79 | 6% |
| 80 Above | 3% |
Males by Age Distribution
| Status | Percentage |
|---|---|
| 0-9 | 12% |
| 10-19 | 12% |
| 20-29 | 14% |
| 30-39 | 13% |
| 40-49 | 12% |
| 50-59 | 13% |
| 60-69 | 10% |
| 70-79 | 11% |
| 80 Above | 2% |
Females by Age Distribution
| Status | Percentage |
|---|---|
| 0-9 | 12% |
| 10-19 | 11% |
| 20-29 | 13% |
| 30-39 | 13% |
| 40-49 | 12% |
| 50-59 | 13% |
| 60-69 | 11% |
| 70-79 | 11% |
| 80 Above | 4% |
