37.3503
-108.288
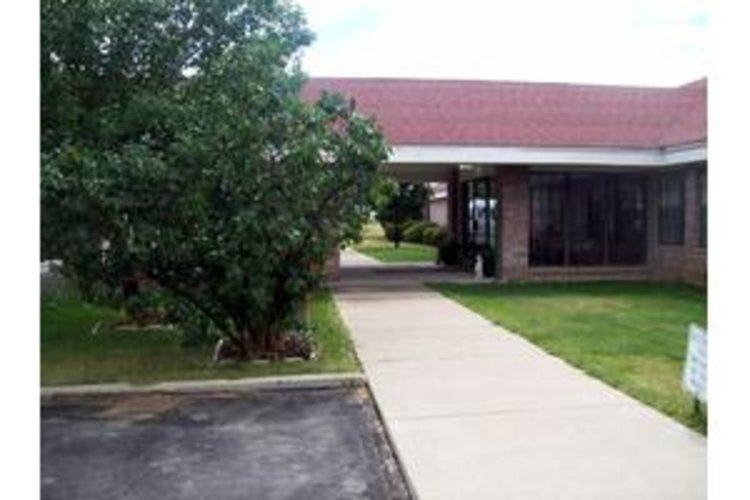
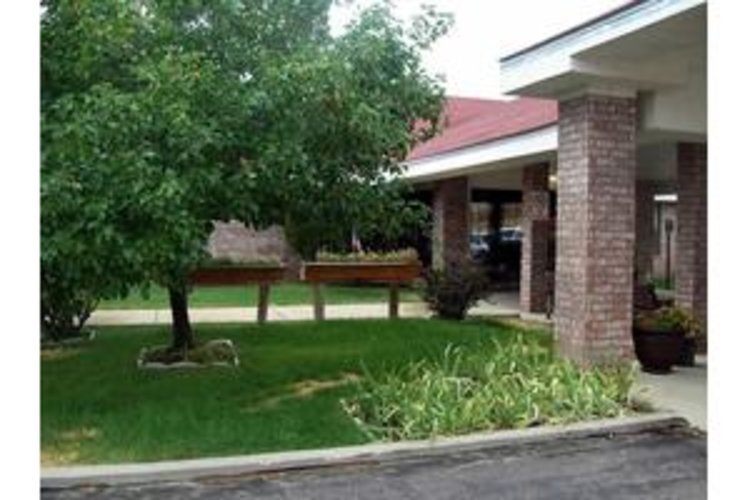
The Valley Inn
$ Call for Rates
211 E 3Rd Ave, Mancos, CO 81328
$ Call for Rates
211 E 3Rd Ave, Mancos, CO 81328
Care Types: Nursing Care
The Valley Inn is a 60-bed skilled nursing facility located in the small, historic town of Mancos, Colorado. The sparsely populated and quiet neighborhood is a primarily middle-income area that offers guests at the facility the convenience of numerous nearby local amenities. Retail shopping, health care services and churches are all within easy reach. A couple of hotels within a 5-minute drive offer a comfortable place to rest for overnight or weekend visitors.
Residents at The Valley Inn receive full-time medical care, which includes assistance with activities of daily living such as dressing, bathing and medication management. Furthermore, the facility delivers rehabilitation services to patients recovering from illness, injury or surgery. These can include ultrasound, which helps reduce inflammation, range of motion exercises, and electrical stimulation to reduce stiffness and repair injured muscles. …. SHOW MORE
Room amenities include kitchenettes that encourage independence and Wi-Fi and cable for communication and entertainment. Guests enjoy restaurant-style dining and there’s a beauty salon and library where residents can spend an afternoon of pampering or quiet moments with a favorite book. Activities such as arts and crafts help improve community engagement, while cooking classes allow guests to try out old, favorite recipes.
SHOW LESS

32%
Single
Marital Status
52%
Married Couples
Community
75%
Drove By Themselves
Commute
4%
Below 9th Grade
Highest Level of Education
27%
Children
Adult vs. Children
13%
0-9
Population by Age
12%
0-9
Males by Age Distribution
12%
0-9
Females by Age Distribution
| Status | Percentage |
|---|---|
| 0-9 | 12% |
| 10-19 | 13% |
| 20-29 | 15% |
| 30-39 | 14% |
| 40-49 | 13% |
| 50-59 | 12% |
| 60-69 | 10% |
| 70-79 | 10% |
| 80 Above | 2% |
| Status | Percentage |
|---|---|
| 0-9 | 12% |
| 10-19 | 12% |
| 20-29 | 13% |
| 30-39 | 14% |
| 40-49 | 12% |
| 50-59 | 13% |
| 60-69 | 11% |
| 70-79 | 10% |
| 80 Above | 3% |
| Status | Percentage |
|---|---|
| Single | 32% |
| Married (Not Separated) | 51% |
| Separated | 1% |
| Widowed | 4% |
| Divorced | 12% |
| Status | Percentage |
|---|---|
| Married Couples | 52% |
| Single Females | 11% |
| Single Males | 5% |
| Living Alone | 9% |
| Living With Family | 23% |
| Status | Percentage |
|---|---|
| Drove By Themselves | 75% |
| Public Transportation | 3% |
| Carpooled | 10% |
| Walked | 3% |
| Occasional Drive | 0% |
| Work At Home | 7% |
| Other | 2% |
| Status | Percentage |
|---|---|
| Below 9th Grade | 4% |
| Bachelors Degree | 24% |
| High School | 22% |
| College | 23% |
| Associate Degree | 8% |
| 9th to 12th Grade | 6% |
| Graduate | 14% |
| Status | Percentage |
|---|---|
| Children | 27% |
| Adult | 73% |
| Status | Percentage |
|---|---|
| 0-9 | 13% |
| 10-19 | 14% |
| 20-29 | 14% |
| 30-39 | 14% |
| 40-49 | 13% |
| 50-59 | 13% |
| 60-69 | 11% |
| 70-79 | 5% |
| 80 Above | 3% |
| Status | Percentage |
|---|---|
| 0-9 | 12% |
| 10-19 | 13% |
| 20-29 | 15% |
| 30-39 | 14% |
| 40-49 | 13% |
| 50-59 | 12% |
| 60-69 | 10% |
| 70-79 | 10% |
| 80 Above | 2% |
| Status | Percentage |
|---|---|
| 0-9 | 12% |
| 10-19 | 12% |
| 20-29 | 13% |
| 30-39 | 14% |
| 40-49 | 12% |
| 50-59 | 13% |
| 60-69 | 11% |
| 70-79 | 10% |
| 80 Above | 3% |
By clicking “Request Info” you agree to our Terms of Use and Privacy Policy. You also consent to receive texts and calls, which may be autodialed, from us and our partner providers; however, your consent is not a condition to using our service.

By clicking “Request Info”, you agree to our Terms of Use, our Privacy Policy, and our Agreement to be Contacted by Telephone. You also consent that we, or our partner providers, may reach out to you about senior living solutions or Medicare insurance using a system that can auto-dial; however, you do not need to consent to this to use our service.