41.1289
-80.0088
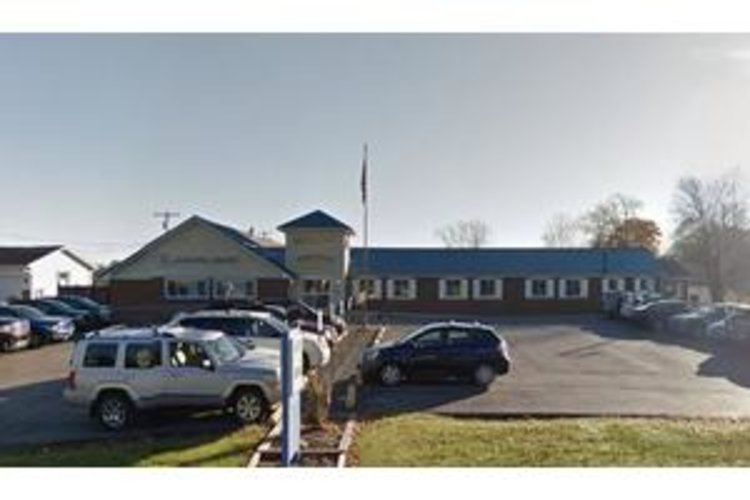
Autumn Grove Care Center
$ Call for Rates
555 SOUTH MAIN STREET, Harrisville, PA 16038
$ Call for Rates
555 SOUTH MAIN STREET, Harrisville, PA 16038
Care Types: Nursing Care
Transitions Healthcare Autumn Grove Care Center, located in Harrisville, PA, offers a variety of care types including skilled nursing care, respite care, short-term rehabilitation care, and independent living. The center is designed to meet the needs of individuals at various stages of their care journey, providing a seamless transition between different levels of care as residents’ needs change over time.
The facility offers both private and semi-private rooms, catering to the preferences and budgets of its residents. …. SHOW MORE
In terms of services, Transitions Healthcare Autumn Grove Care Center is staffed with nurses and offers physical and occupational therapy/rehabilitation, along with assistance with activities of daily living (ADLs). These services are crucial for residents who require medical care, rehabilitation after an injury or surgery, or help with everyday tasks. The presence of trained nurses and therapists ensures that residents receive professional care and support tailored to their individual needs.
SHOW LESS
34%
Single
Marital Status
46%
Married Couples
Community
77%
Drove By Themselves
Commute
4%
Below 9th Grade
Highest Level of Education
25%
Children
Adult vs. Children
11%
0-9
Population by Age
11%
0-9
Males by Age Distribution
10%
0-9
Females by Age Distribution
| Status | Percentage |
|---|---|
| 0-9 | 11% |
| 10-19 | 12% |
| 20-29 | 13% |
| 30-39 | 11% |
| 40-49 | 12% |
| 50-59 | 14% |
| 60-69 | 11% |
| 70-79 | 13% |
| 80 Above | 3% |
| Status | Percentage |
|---|---|
| 0-9 | 10% |
| 10-19 | 11% |
| 20-29 | 12% |
| 30-39 | 11% |
| 40-49 | 12% |
| 50-59 | 14% |
| 60-69 | 12% |
| 70-79 | 13% |
| 80 Above | 6% |
| Status | Percentage |
|---|---|
| Single | 34% |
| Married (Not Separated) | 48% |
| Separated | 2% |
| Widowed | 7% |
| Divorced | 10% |
| Status | Percentage |
|---|---|
| Married Couples | 46% |
| Single Females | 11% |
| Single Males | 4% |
| Living Alone | 11% |
| Living With Family | 27% |
| Status | Percentage |
|---|---|
| Drove By Themselves | 77% |
| Public Transportation | 5% |
| Carpooled | 9% |
| Walked | 4% |
| Occasional Drive | 0% |
| Work At Home | 4% |
| Other | 1% |
| Status | Percentage |
|---|---|
| Below 9th Grade | 4% |
| Bachelors Degree | 17% |
| High School | 37% |
| College | 16% |
| Associate Degree | 8% |
| 9th to 12th Grade | 7% |
| Graduate | 11% |
| Status | Percentage |
|---|---|
| Children | 25% |
| Adult | 75% |
| Status | Percentage |
|---|---|
| 0-9 | 11% |
| 10-19 | 13% |
| 20-29 | 13% |
| 30-39 | 12% |
| 40-49 | 13% |
| 50-59 | 15% |
| 60-69 | 12% |
| 70-79 | 7% |
| 80 Above | 5% |
| Status | Percentage |
|---|---|
| 0-9 | 11% |
| 10-19 | 12% |
| 20-29 | 13% |
| 30-39 | 11% |
| 40-49 | 12% |
| 50-59 | 14% |
| 60-69 | 11% |
| 70-79 | 13% |
| 80 Above | 3% |
| Status | Percentage |
|---|---|
| 0-9 | 10% |
| 10-19 | 11% |
| 20-29 | 12% |
| 30-39 | 11% |
| 40-49 | 12% |
| 50-59 | 14% |
| 60-69 | 12% |
| 70-79 | 13% |
| 80 Above | 6% |
By clicking “Request Info” you agree to our Terms of Use and Privacy Policy. You also consent to receive texts and calls, which may be autodialed, from us and our partner providers; however, your consent is not a condition to using our service.

By clicking “Request Info”, you agree to our Terms of Use, our Privacy Policy, and our Agreement to be Contacted by Telephone. You also consent that we, or our partner providers, may reach out to you about senior living solutions or Medicare insurance using a system that can auto-dial; however, you do not need to consent to this to use our service.