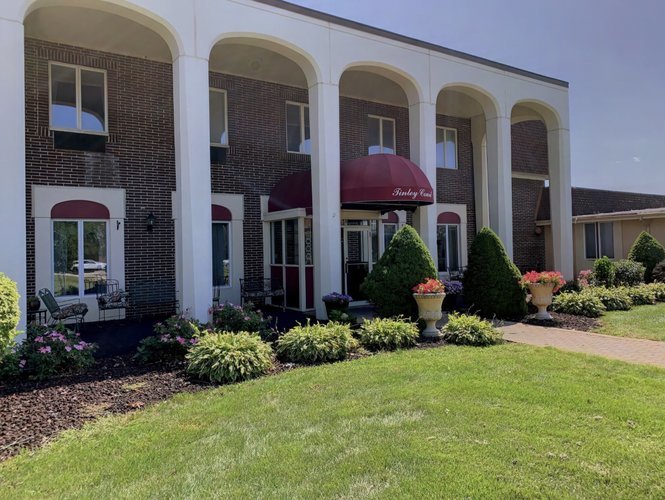
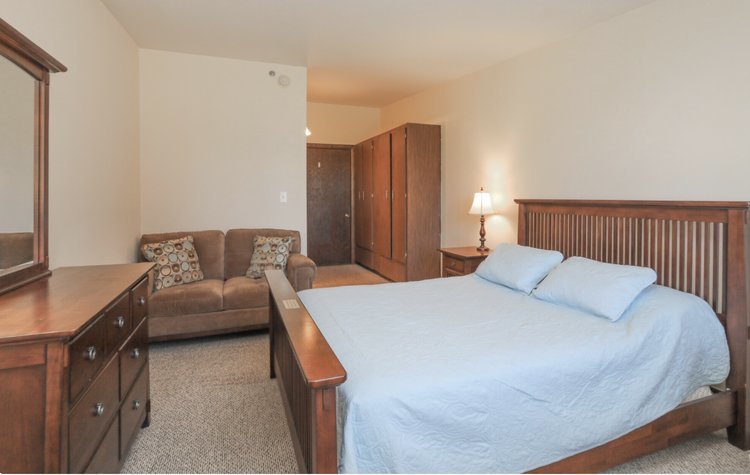
Tinley Court
$ Call for Rates
16301 S Brementowne Road, Tinley Park, IL 60477
Overview
Care Types: Independent Living
Tinley Court is a catered independent living community. Our chefs cook three meals a day, seven days a week for our residents. There are a number of grocery stores, shops and restaurants within a mile of our community, including several parks and walking trails. For residents that may need a little extra help to age gracefully, we partner with a caregiving service to help with activities of daily living a la carte!
Amenities
- Adults 55 and over accepted
- All-inclusive pricing structure
- Arts and crafts area
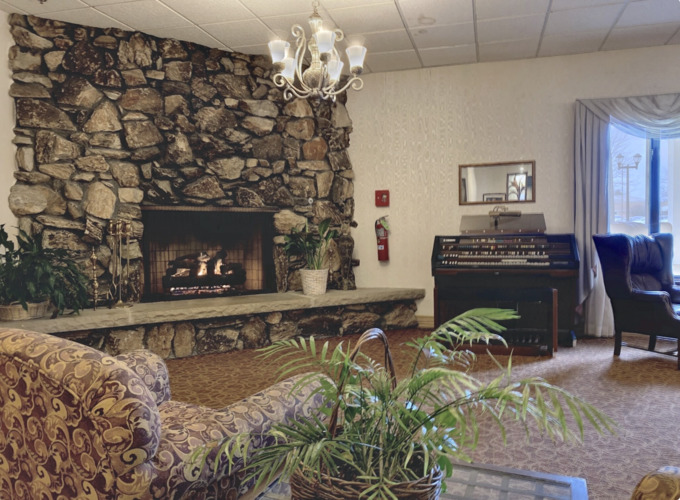
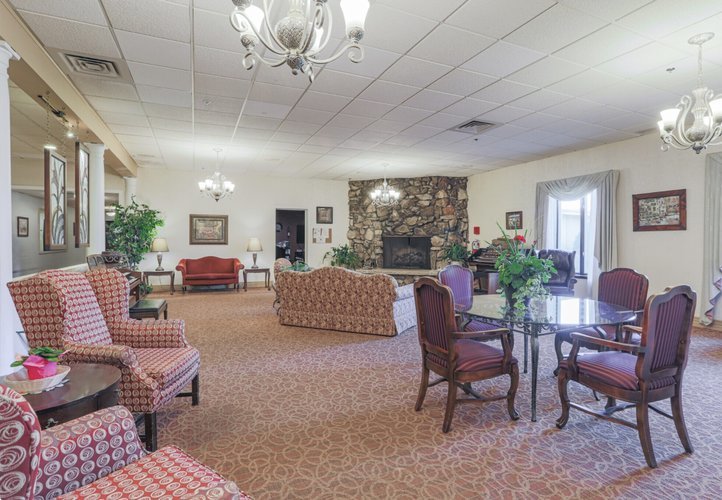
- Common Areas with TVs
- Computer area
- Free Transportation Services
- Guests Allowed at Meal Time
- Gym
- Overnight Guests Allowed
- Housekeeping Services Available
- In-house homecare
- In-house Laundry and Drycleaning
- In-House Religious Services
- Kitchenette in resident rooms
- Entry Fee Required
- Community Dining Available
- Nintendo Wii bowling
- Parking for Guests
- VA Benefits Assistance
- Laundry Services for Linens
- Game Nights
- Offsite Activities Available
- On-site haircuts/barber services
- On-site Resident Parking
- Outdoor Patios and Gardens
- Accepts Check Payments
- Physical Therapist Services
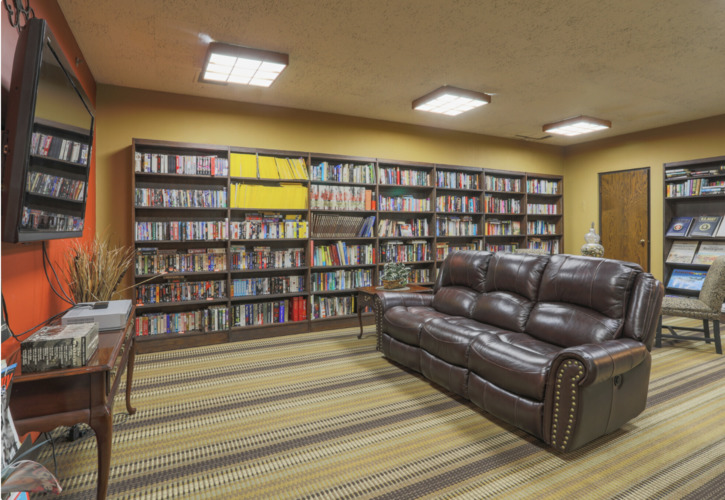
- Recreation room
- Resident musical group
- Respite Care Available
- Room service available
- Licensed by the State
- Some Pets Are Allowed
- Studio Apartments Available
- Yoga/chair yoga classes
Contact for available floor plans
Contact for available Payment Options
DEMOGRAPHIC BREAKDOWN
35%
Single
Marital Status
48%
Married Couples
Community
73%
Drove By Themselves
Commute
6%
Below 9th Grade
Highest Level of Education
27%
Children
Adult vs. Children
12%
0-9
Population by Age
12%
0-9
Males by Age Distribution
11%
0-9
Females by Age Distribution
Males by Age Distribution
Status | Percentage |
---|---|
0-9 | 12% |
10-19 | 13% |
20-29 | 13% |
30-39 | 13% |
40-49 | 12% |
50-59 | 13% |
60-69 | 10% |
70-79 | 11% |
80 Above | 3% |
Females by Age Distribution
Status | Percentage |
---|---|
0-9 | 11% |
10-19 | 12% |
20-29 | 13% |
30-39 | 13% |
40-49 | 12% |
50-59 | 13% |
60-69 | 10% |
70-79 | 11% |
80 Above | 4% |
Marital Status
Status | Percentage |
---|---|
Single | 35% |
Married (Not Separated) | 47% |
Separated | 2% |
Widowed | 6% |
Divorced | 10% |
Community
Status | Percentage |
---|---|
Married Couples | 48% |
Single Females | 13% |
Single Males | 5% |
Living Alone | 10% |
Living With Family | 25% |
Commute
Status | Percentage |
---|---|
Drove By Themselves | 73% |
Public Transportation | 9% |
Carpooled | 9% |
Walked | 3% |
Occasional Drive | 0% |
Work At Home | 4% |
Other | 2% |
Highest Level of Education
Status | Percentage |
---|---|
Below 9th Grade | 6% |
Bachelors Degree | 20% |
High School | 27% |
College | 21% |
Associate Degree | 8% |
9th to 12th Grade | 7% |
Graduate | 12% |
Adult vs. Children
Status | Percentage |
---|---|
Children | 27% |
Adult | 73% |
Population by Age
Status | Percentage |
---|---|
0-9 | 12% |
10-19 | 14% |
20-29 | 13% |
30-39 | 14% |
40-49 | 13% |
50-59 | 14% |
60-69 | 11% |
70-79 | 6% |
80 Above | 4% |
Males by Age Distribution
Status | Percentage |
---|---|
0-9 | 12% |
10-19 | 13% |
20-29 | 13% |
30-39 | 13% |
40-49 | 12% |
50-59 | 13% |
60-69 | 10% |
70-79 | 11% |
80 Above | 3% |
Females by Age Distribution
Status | Percentage |
---|---|
0-9 | 11% |
10-19 | 12% |
20-29 | 13% |
30-39 | 13% |
40-49 | 12% |
50-59 | 13% |
60-69 | 10% |
70-79 | 11% |
80 Above | 4% |