The Villa Rehab
$ Call for Rates
7 Forest Hill Dr, Saint Albans, VT 05478
Overview
Care Types: Nursing Care
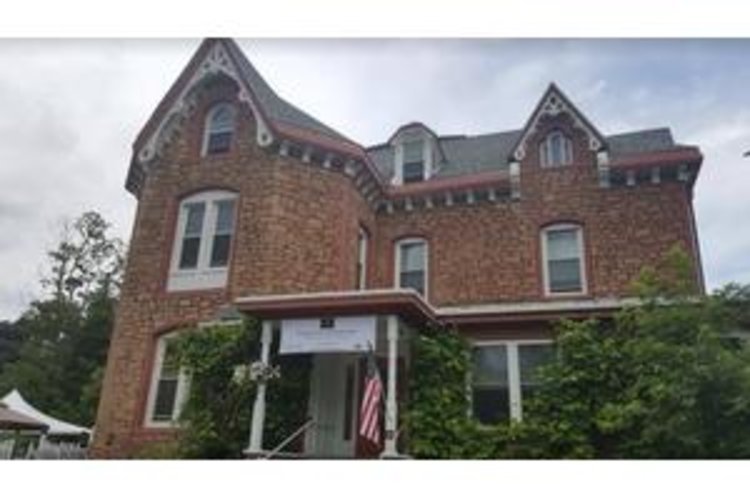
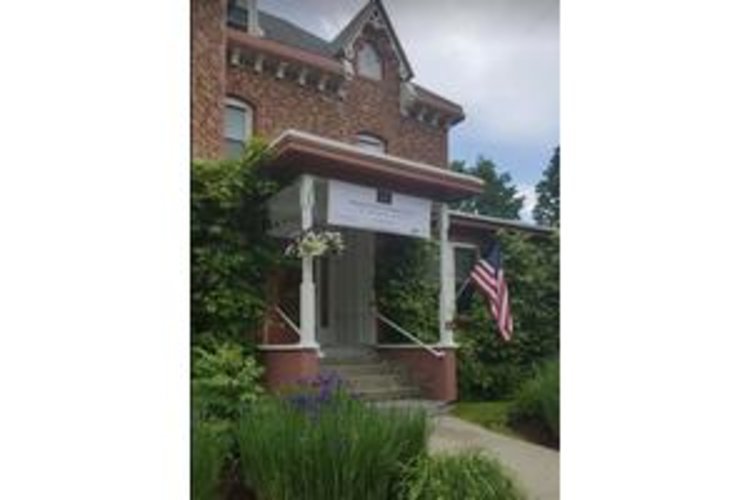
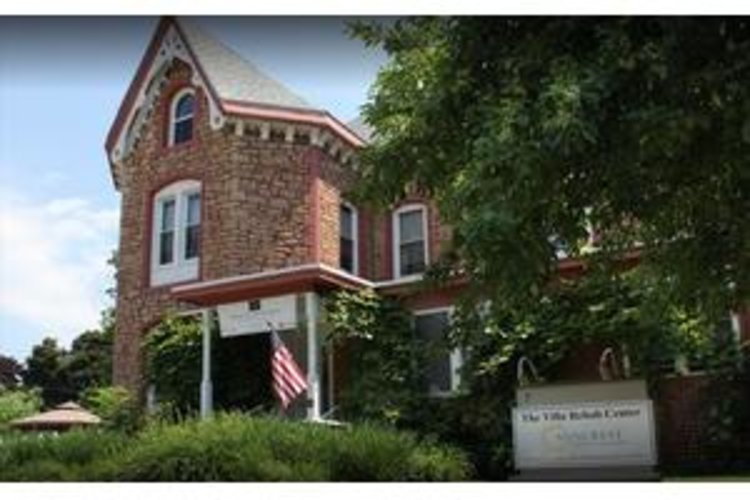
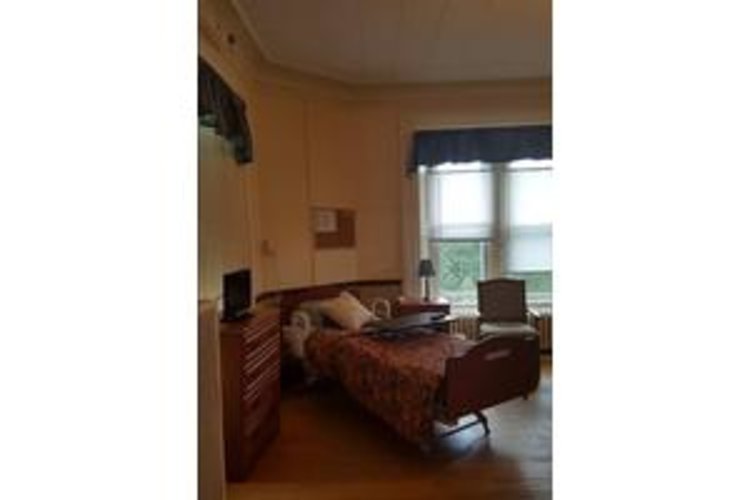
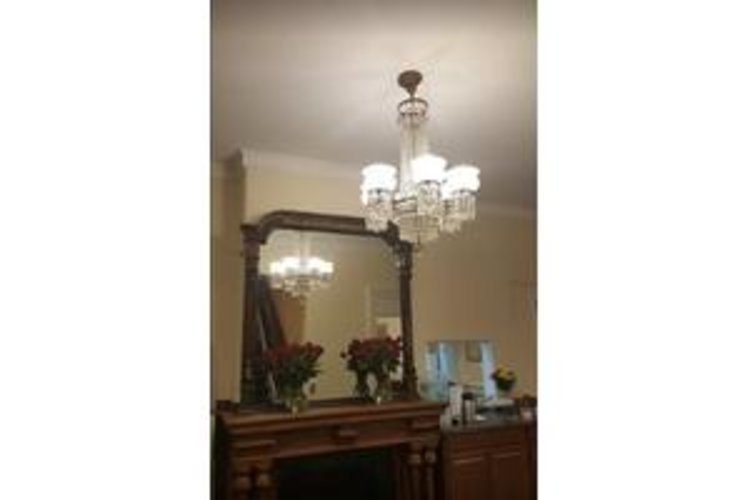
Welcome to The Villa Rehab! The Villa Rehab Center is a private, locally owned 30-bed, all-inclusive skilled nursing center uniquely specializing in rehabilitation and long-term care. Adorned with elegance and a professional interdisciplinary team, the Villa’s commitment to excellence promotes independence, exceptional quality care, and enhancing quality of life. At Villa Rehab Center, our friendly and knowledgeable staff is committed to ensuring our patients have a healing and relaxing stay at our beautiful, historic home. We offer a variety of elder care services and personalize each treatment for our patients’ and residents’ needs.
At Villa Rehab Center, our reputation is determined by the quality care we provide to our patients. Our long-term care program offers nursing services 24 hours a day from our friendly and knowledgeable staff. Whether it is nursing, therapy, social services, activities or dietary, our team caters to your individual care needs.
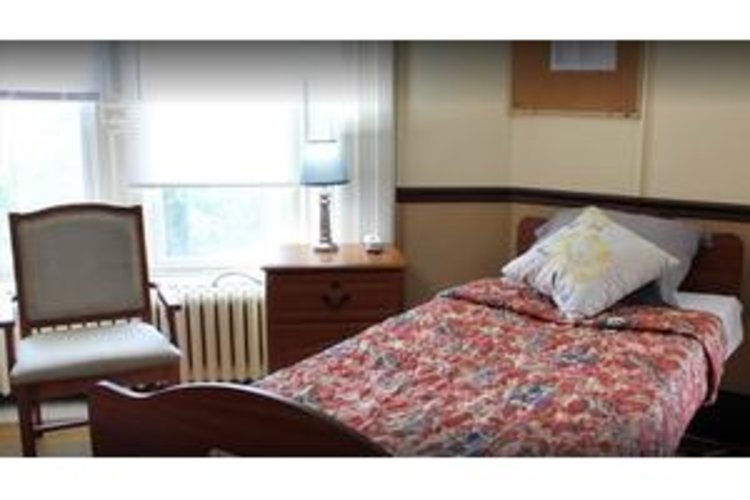
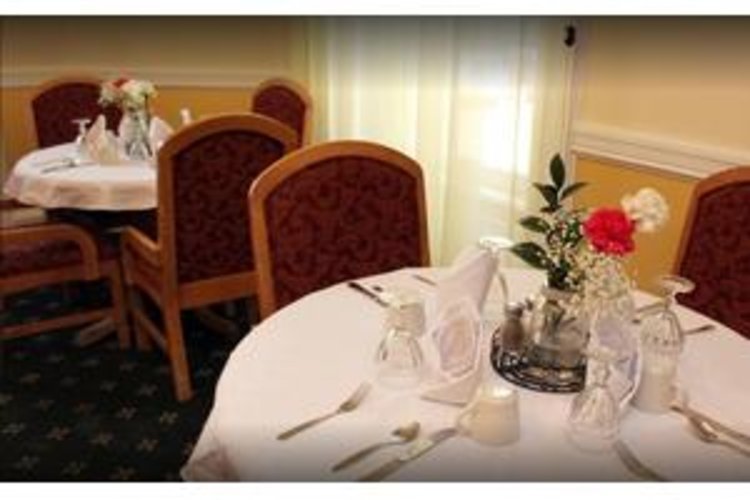
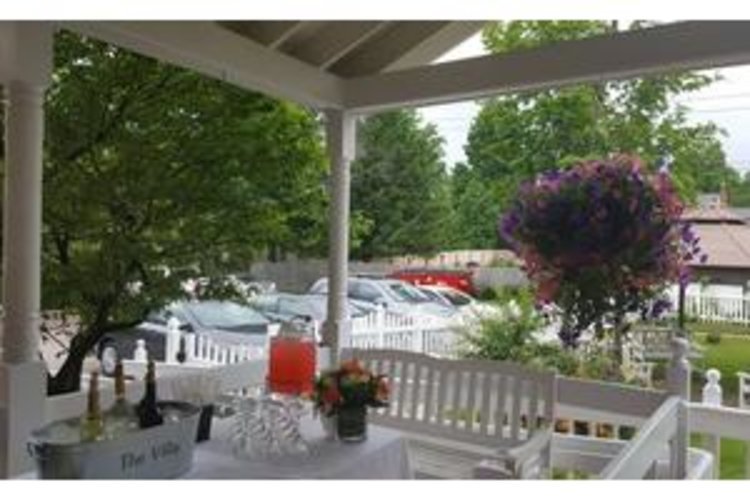
Our renowned hospitality and care services are delivered by crafting a personal and individualized program for you. We strive to create both an environment that facilitates healthy living, and also a fun place for you to reside. We offer a variety of activities such as gardening, baking, crafts and more, open to anyone who wishes to participate.
Contact for available floor plans
Contact for available Payment Options
DEMOGRAPHIC BREAKDOWN
32%
Single
Marital Status
49%
Married Couples
Community
75%
Drove By Themselves
Commute
3%
Below 9th Grade
Highest Level of Education
24%
Children
Adult vs. Children
10%
0-9
Population by Age
10%
0-9
Males by Age Distribution
9%
0-9
Females by Age Distribution
Males by Age Distribution
Status | Percentage |
---|---|
0-9 | 10% |
10-19 | 13% |
20-29 | 12% |
30-39 | 11% |
40-49 | 11% |
50-59 | 14% |
60-69 | 13% |
70-79 | 13% |
80 Above | 3% |
Females by Age Distribution
Status | Percentage |
---|---|
0-9 | 9% |
10-19 | 11% |
20-29 | 12% |
30-39 | 11% |
40-49 | 11% |
50-59 | 15% |
60-69 | 13% |
70-79 | 12% |
80 Above | 5% |
Marital Status
Status | Percentage |
---|---|
Single | 32% |
Married (Not Separated) | 49% |
Separated | 1% |
Widowed | 6% |
Divorced | 13% |
Community
Status | Percentage |
---|---|
Married Couples | 49% |
Single Females | 9% |
Single Males | 4% |
Living Alone | 11% |
Living With Family | 27% |
Commute
Status | Percentage |
---|---|
Drove By Themselves | 75% |
Public Transportation | 1% |
Carpooled | 10% |
Walked | 6% |
Occasional Drive | 0% |
Work At Home | 7% |
Other | 2% |
Highest Level of Education
Status | Percentage |
---|---|
Below 9th Grade | 3% |
Bachelors Degree | 21% |
High School | 31% |
College | 17% |
Associate Degree | 8% |
9th to 12th Grade | 5% |
Graduate | 14% |
Adult vs. Children
Status | Percentage |
---|---|
Children | 24% |
Adult | 76% |
Population by Age
Status | Percentage |
---|---|
0-9 | 10% |
10-19 | 14% |
20-29 | 12% |
30-39 | 12% |
40-49 | 12% |
50-59 | 16% |
60-69 | 14% |
70-79 | 7% |
80 Above | 5% |
Males by Age Distribution
Status | Percentage |
---|---|
0-9 | 10% |
10-19 | 13% |
20-29 | 12% |
30-39 | 11% |
40-49 | 11% |
50-59 | 14% |
60-69 | 13% |
70-79 | 13% |
80 Above | 3% |
Females by Age Distribution
Status | Percentage |
---|---|
0-9 | 9% |
10-19 | 11% |
20-29 | 12% |
30-39 | 11% |
40-49 | 11% |
50-59 | 15% |
60-69 | 13% |
70-79 | 12% |
80 Above | 5% |