Lutheran Home at Hollidaysburg
$ Call for Rates
916 HICKORY STREET, Hollidaysburg, PA 16648
Overview
Care Types: Nursing Care, Retirement, Independent Living, Assisted Living
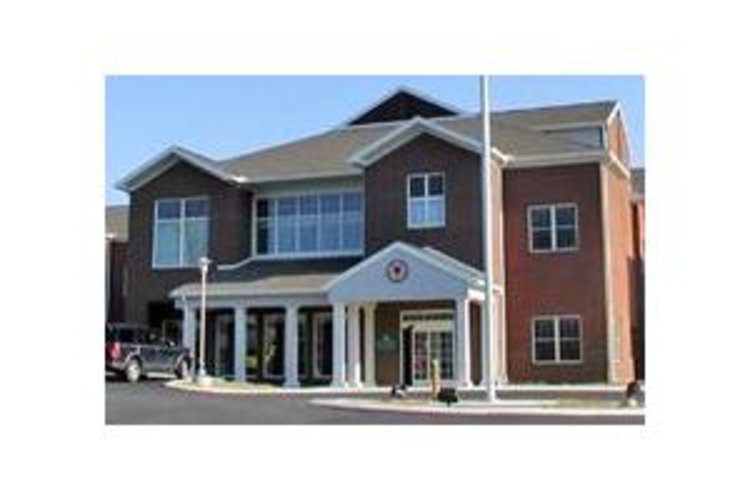
The Lutheran Home at Hollidaysburg is located in the borough of Hollidaysburg on the banks of the Juniata River. The borough has a population of just over 5,000 residents and is known as a peaceful and safe place to live. Residents of the community can easily walk to shops and restaurants on the main street, where they can socialize with friends and family.
The Lutheran Home at Hollidaysburg offers independent living and skilled nursing care. Residents in the independent living section can choose between multiple cottage and apartment floor plans to find the best option to suit their needs. All accommodation features full kitchens and spacious living areas. Physical, occupational and speech therapy services are provided on-site. Seniors in the independent living section have an emergency button to call for assistance if required. Residents have priority access to the skilled nursing care unit. …. SHOW MORE
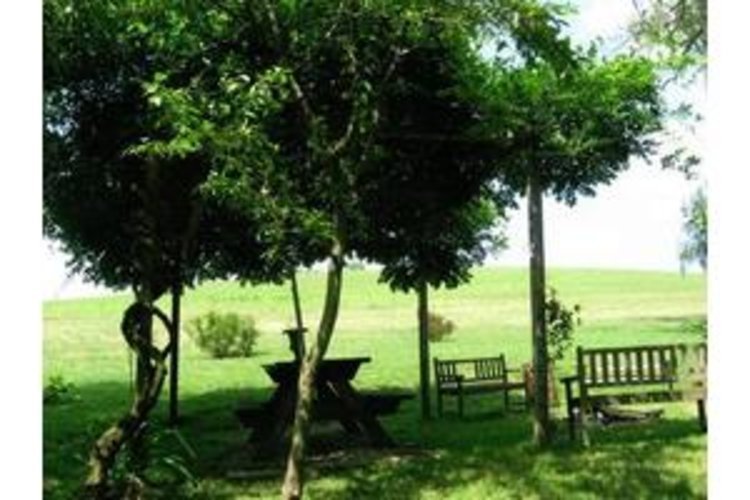
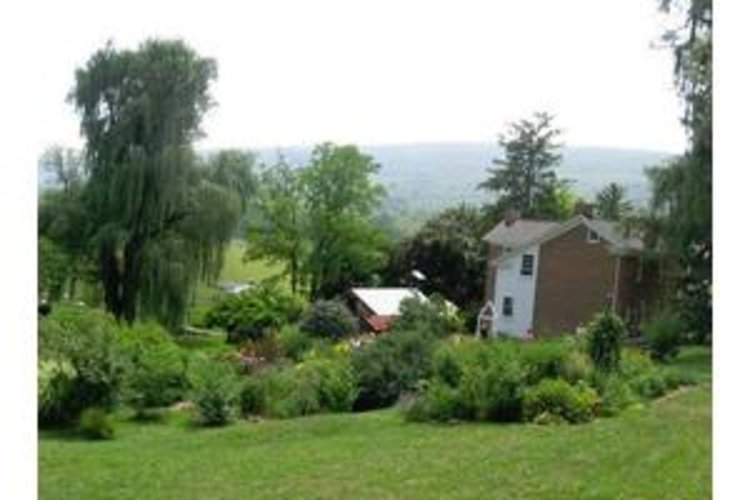
The community is operated by the Lutheran Church, and religious services are offered on-site. Residents have access to spacious gardens where they can go for a walk or spend time gardening. An on-site hair salon is available.
SHOW LESSContact for available floor plans
Contact for available Payment Options
Neighborhood & Demographics
DEMOGRAPHIC BREAKDOWN
34%
Single
Marital Status
46%
Married Couples
Community
77%
Drove By Themselves
Commute
4%
Below 9th Grade
Highest Level of Education
25%
Children
Adult vs. Children
11%
0-9
Population by Age
11%
0-9
Males by Age Distribution
10%
0-9
Females by Age Distribution
Males by Age Distribution
Status | Percentage |
---|---|
0-9 | 11% |
10-19 | 12% |
20-29 | 13% |
30-39 | 11% |
40-49 | 12% |
50-59 | 14% |
60-69 | 11% |
70-79 | 13% |
80 Above | 3% |
Females by Age Distribution
Status | Percentage |
---|---|
0-9 | 10% |
10-19 | 11% |
20-29 | 12% |
30-39 | 11% |
40-49 | 12% |
50-59 | 14% |
60-69 | 12% |
70-79 | 13% |
80 Above | 6% |
Marital Status
Status | Percentage |
---|---|
Single | 34% |
Married (Not Separated) | 48% |
Separated | 2% |
Widowed | 7% |
Divorced | 10% |
Community
Status | Percentage |
---|---|
Married Couples | 46% |
Single Females | 11% |
Single Males | 4% |
Living Alone | 11% |
Living With Family | 27% |
Commute
Status | Percentage |
---|---|
Drove By Themselves | 77% |
Public Transportation | 5% |
Carpooled | 9% |
Walked | 4% |
Occasional Drive | 0% |
Work At Home | 4% |
Other | 1% |
Highest Level of Education
Status | Percentage |
---|---|
Below 9th Grade | 4% |
Bachelors Degree | 17% |
High School | 37% |
College | 16% |
Associate Degree | 8% |
9th to 12th Grade | 7% |
Graduate | 11% |
Adult vs. Children
Status | Percentage |
---|---|
Children | 25% |
Adult | 75% |
Population by Age
Status | Percentage |
---|---|
0-9 | 11% |
10-19 | 13% |
20-29 | 13% |
30-39 | 12% |
40-49 | 13% |
50-59 | 15% |
60-69 | 12% |
70-79 | 7% |
80 Above | 5% |
Males by Age Distribution
Status | Percentage |
---|---|
0-9 | 11% |
10-19 | 12% |
20-29 | 13% |
30-39 | 11% |
40-49 | 12% |
50-59 | 14% |
60-69 | 11% |
70-79 | 13% |
80 Above | 3% |
Females by Age Distribution
Status | Percentage |
---|---|
0-9 | 10% |
10-19 | 11% |
20-29 | 12% |
30-39 | 11% |
40-49 | 12% |
50-59 | 14% |
60-69 | 12% |
70-79 | 13% |
80 Above | 6% |