Summit Towers
$ Call for Rates
201 Locust St, Knoxville, TN 37902
Overview
Care Types: Independent Living, Retirement
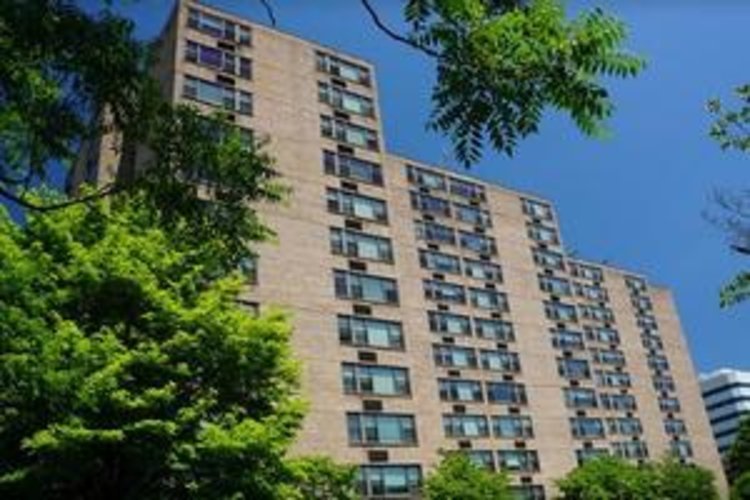
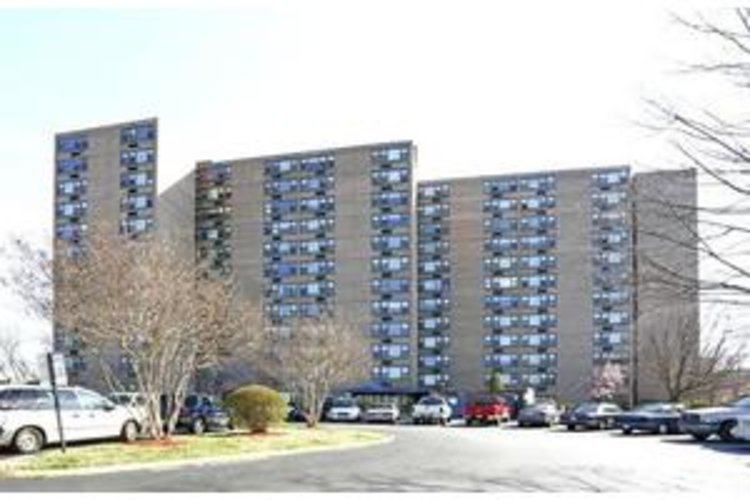
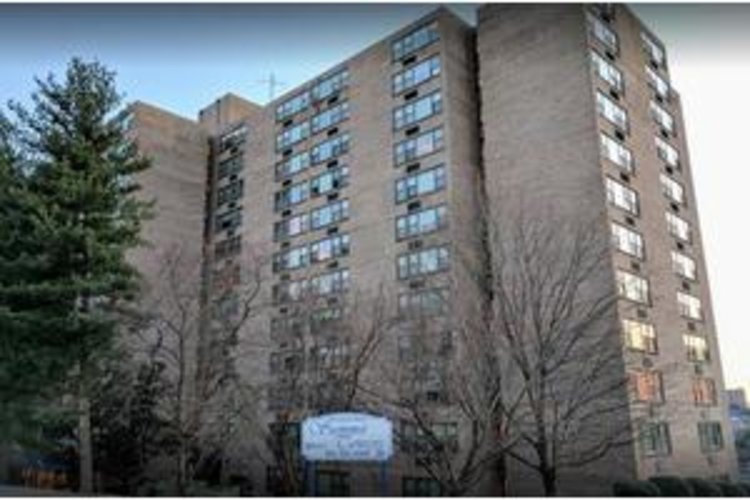
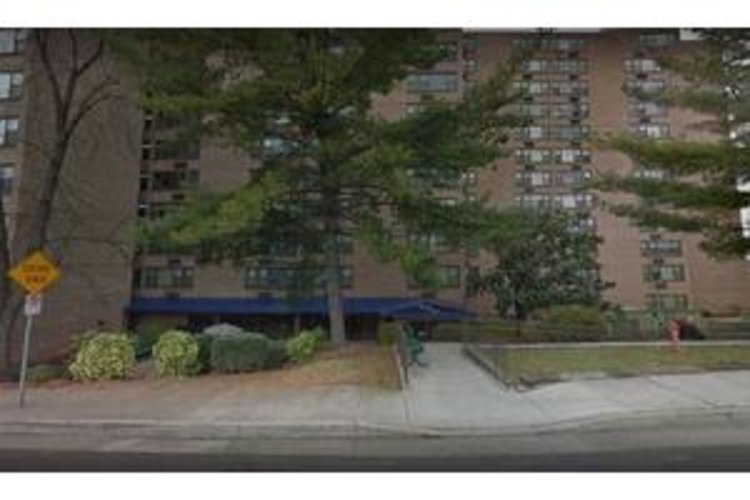
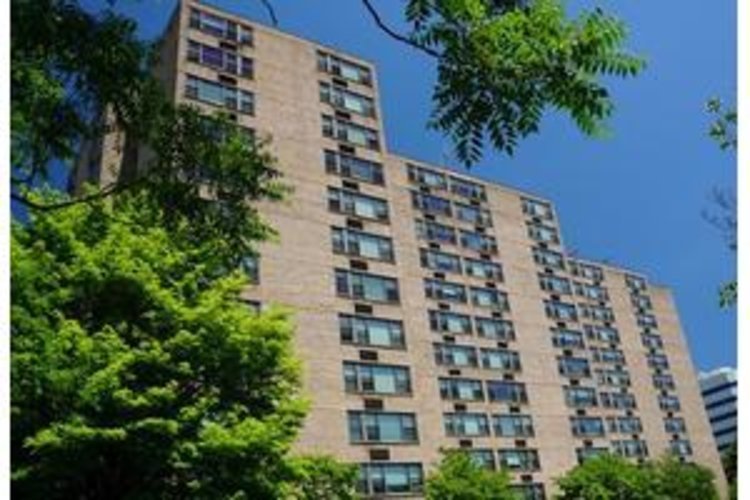
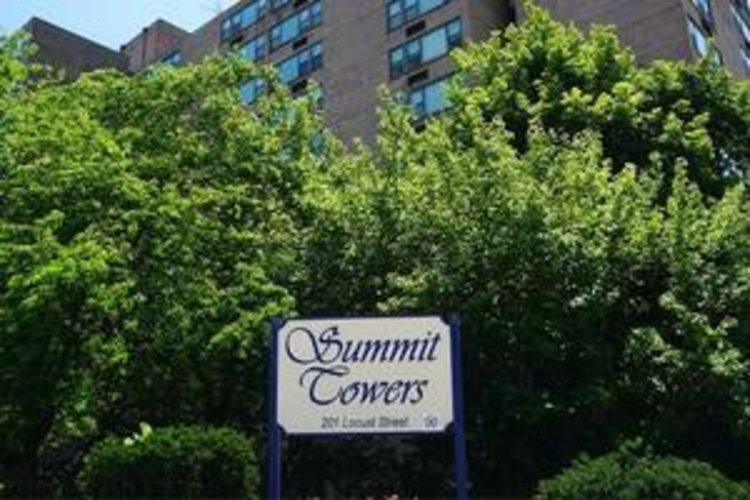
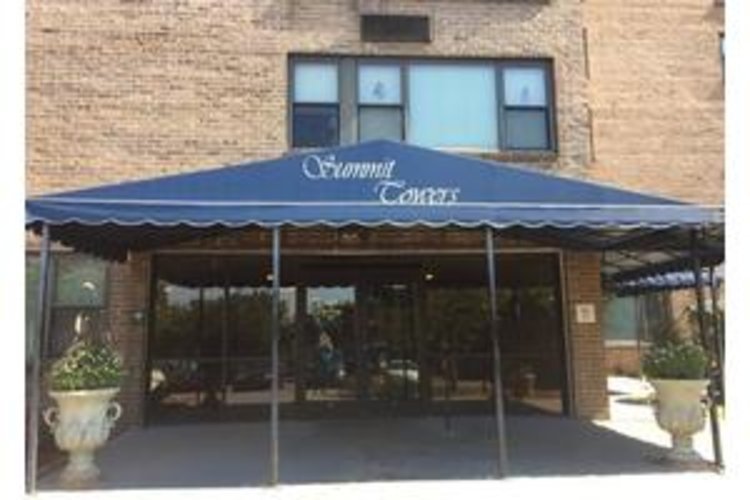
Welcome to Summit Towers! Welcome to Summit Towers, an apartment community for those 62 and better, handicapped, or disabled. Enjoy the comfort of quiet, community living here at Summit Towers!
Our spacious 1 bedroom apartment homes are thoughtfully designed with your comfort and convenience in mind. In addition to our great floor plans and maintenance free living, our community has the amenities you want and deserve. For your pleasure, our community features on-site laundry, a courtyard, and a convenient downtown location.
For your benefit, our community’s service coordinator is readily available to assist you with your needs.
Summit Towers is ideally situated to give you easy access to the best of what the area has to offer. We are located a short distance from downtown, shopping, the UT Campus, and provides easy interstate access.
Here at Summit Towers, we understand that your pet is a special part of your family. We are pet friendly and look forward to making your furry friend a part of our community!
….
SHOW MORE
Contact for available floor plans
Contact for available Payment Options
DEMOGRAPHIC BREAKDOWN
30%
Single
Marital Status
47%
Married Couples
Community
84%
Drove By Themselves
Commute
6%
Below 9th Grade
Highest Level of Education
27%
Children
Adult vs. Children
12%
0-9
Population by Age
12%
0-9
Males by Age Distribution
11%
0-9
Females by Age Distribution
Males by Age Distribution
Status | Percentage |
---|---|
0-9 | 12% |
10-19 | 13% |
20-29 | 13% |
30-39 | 12% |
40-49 | 12% |
50-59 | 13% |
60-69 | 10% |
70-79 | 12% |
80 Above | 2% |
Females by Age Distribution
Status | Percentage |
---|---|
0-9 | 11% |
10-19 | 12% |
20-29 | 13% |
30-39 | 12% |
40-49 | 12% |
50-59 | 13% |
60-69 | 11% |
70-79 | 12% |
80 Above | 4% |
Marital Status
Status | Percentage |
---|---|
Single | 30% |
Married (Not Separated) | 48% |
Separated | 2% |
Widowed | 6% |
Divorced | 13% |
Community
Status | Percentage |
---|---|
Married Couples | 47% |
Single Females | 13% |
Single Males | 4% |
Living Alone | 10% |
Living With Family | 25% |
Commute
Status | Percentage |
---|---|
Drove By Themselves | 84% |
Public Transportation | 1% |
Carpooled | 9% |
Walked | 1% |
Occasional Drive | 0% |
Work At Home | 4% |
Other | 1% |
Highest Level of Education
Status | Percentage |
---|---|
Below 9th Grade | 6% |
Bachelors Degree | 16% |
High School | 33% |
College | 21% |
Associate Degree | 6% |
9th to 12th Grade | 9% |
Graduate | 9% |
Adult vs. Children
Status | Percentage |
---|---|
Children | 27% |
Adult | 73% |
Population by Age
Status | Percentage |
---|---|
0-9 | 12% |
10-19 | 14% |
20-29 | 13% |
30-39 | 13% |
40-49 | 13% |
50-59 | 14% |
60-69 | 11% |
70-79 | 6% |
80 Above | 4% |
Males by Age Distribution
Status | Percentage |
---|---|
0-9 | 12% |
10-19 | 13% |
20-29 | 13% |
30-39 | 12% |
40-49 | 12% |
50-59 | 13% |
60-69 | 10% |
70-79 | 12% |
80 Above | 2% |
Females by Age Distribution
Status | Percentage |
---|---|
0-9 | 11% |
10-19 | 12% |
20-29 | 13% |
30-39 | 12% |
40-49 | 12% |
50-59 | 13% |
60-69 | 11% |
70-79 | 12% |
80 Above | 4% |