40.3607
-80.0141
Driving Directions
Street View
Photos
Map
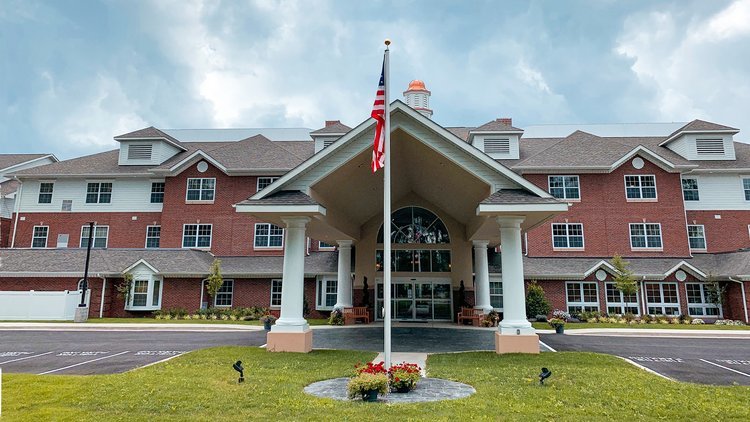
South Hills Square Retirement Community
$ Call for Rates
3603 McRoberts Road, Pittsburgh, PA 15234
Overview
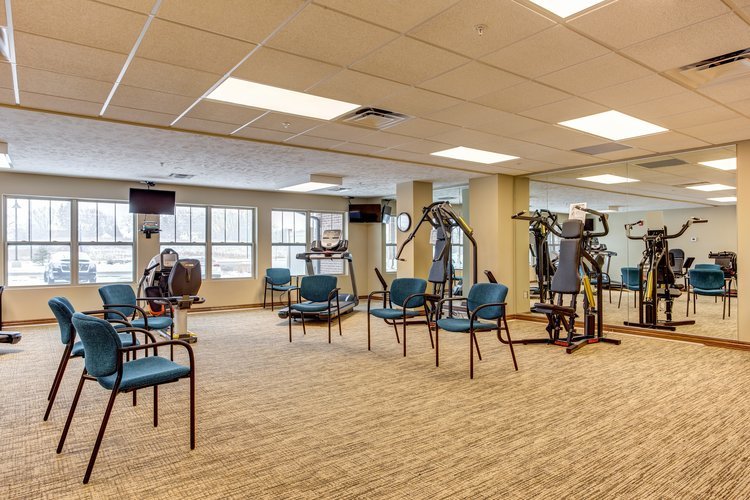
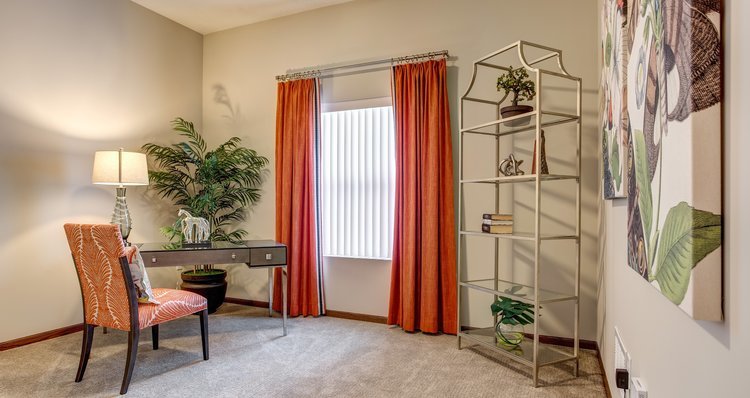
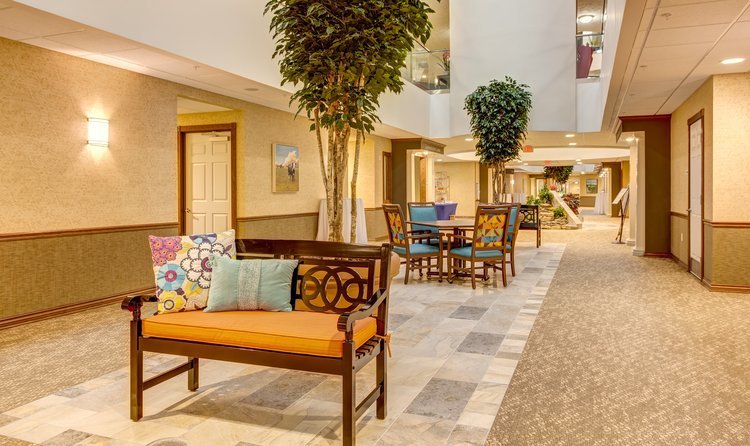
Care Types: Independent Living
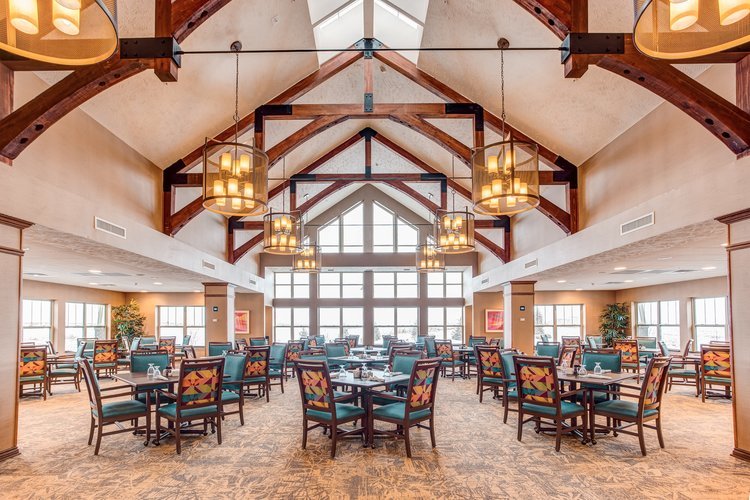
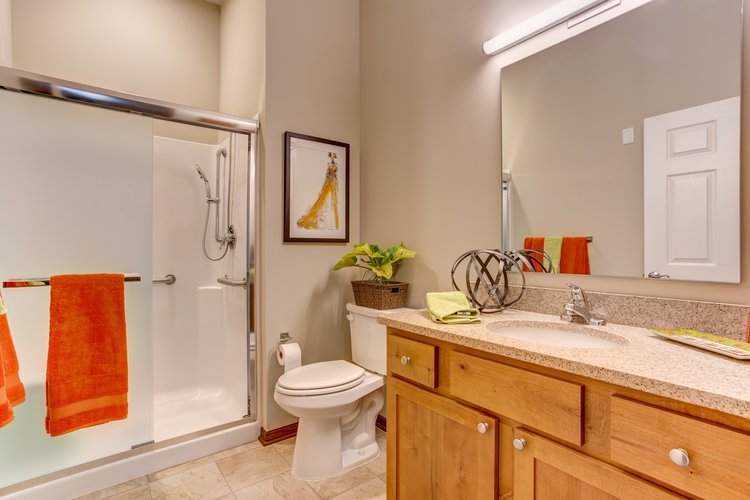
South Hills Square Retirement Community is a resort-style place with a monthly rent that includes a variety of services without any hidden fees. The Freedom Dining program is one of the most talked-about amenities among its residents. With three nutritious meals each day and flexible hours, this signature amenity goes hand in hand with the freedom to do as much or as little as residents desire.
Amenities
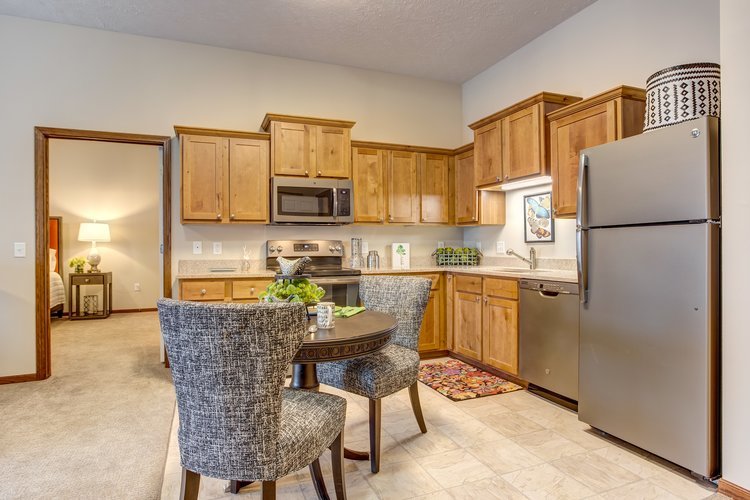
- 2-bedroom apartments
- Adults 55 and over accepted
- All-inclusive pricing structure
- Three-bedroom units
- Semi-Private Apartments/Rooms
- Single Room Units Available
- Some Pets Are Allowed
- Studio Apartments Available
Contact for available floor plans
Contact for available Payment Options
Neighborhood & Demographics
10 closest amenities
Show Map Show List
10 closest amenities
Grocery stores
Coffee shops
Gas Stations
Restaurants
Pharmacies
Financial services
Powered by 
DEMOGRAPHIC BREAKDOWN
34%
Single
Marital Status
46%
Married Couples
Community
77%
Drove By Themselves
Commute
4%
Below 9th Grade
Highest Level of Education
25%
Children
Adult vs. Children
11%
0-9
Population by Age
11%
0-9
Males by Age Distribution
10%
0-9
Females by Age Distribution
Males by Age Distribution
| Status | Percentage |
|---|---|
| 0-9 | 11% |
| 10-19 | 12% |
| 20-29 | 13% |
| 30-39 | 11% |
| 40-49 | 12% |
| 50-59 | 14% |
| 60-69 | 11% |
| 70-79 | 13% |
| 80 Above | 3% |
Females by Age Distribution
| Status | Percentage |
|---|---|
| 0-9 | 10% |
| 10-19 | 11% |
| 20-29 | 12% |
| 30-39 | 11% |
| 40-49 | 12% |
| 50-59 | 14% |
| 60-69 | 12% |
| 70-79 | 13% |
| 80 Above | 6% |
Marital Status
| Status | Percentage |
|---|---|
| Single | 34% |
| Married (Not Separated) | 48% |
| Separated | 2% |
| Widowed | 7% |
| Divorced | 10% |
Community
| Status | Percentage |
|---|---|
| Married Couples | 46% |
| Single Females | 11% |
| Single Males | 4% |
| Living Alone | 11% |
| Living With Family | 27% |
Commute
| Status | Percentage |
|---|---|
| Drove By Themselves | 77% |
| Public Transportation | 5% |
| Carpooled | 9% |
| Walked | 4% |
| Occasional Drive | 0% |
| Work At Home | 4% |
| Other | 1% |
Highest Level of Education
| Status | Percentage |
|---|---|
| Below 9th Grade | 4% |
| Bachelors Degree | 17% |
| High School | 37% |
| College | 16% |
| Associate Degree | 8% |
| 9th to 12th Grade | 7% |
| Graduate | 11% |
Adult vs. Children
| Status | Percentage |
|---|---|
| Children | 25% |
| Adult | 75% |
Population by Age
| Status | Percentage |
|---|---|
| 0-9 | 11% |
| 10-19 | 13% |
| 20-29 | 13% |
| 30-39 | 12% |
| 40-49 | 13% |
| 50-59 | 15% |
| 60-69 | 12% |
| 70-79 | 7% |
| 80 Above | 5% |
Males by Age Distribution
| Status | Percentage |
|---|---|
| 0-9 | 11% |
| 10-19 | 12% |
| 20-29 | 13% |
| 30-39 | 11% |
| 40-49 | 12% |
| 50-59 | 14% |
| 60-69 | 11% |
| 70-79 | 13% |
| 80 Above | 3% |
Females by Age Distribution
| Status | Percentage |
|---|---|
| 0-9 | 10% |
| 10-19 | 11% |
| 20-29 | 12% |
| 30-39 | 11% |
| 40-49 | 12% |
| 50-59 | 14% |
| 60-69 | 12% |
| 70-79 | 13% |
| 80 Above | 6% |
