Red Cliffs Health and Rehab
$ Call for Rates
1745 E 280 N, Saint George, UT 84790
Overview
Care Types: Assisted Living, Nursing Care
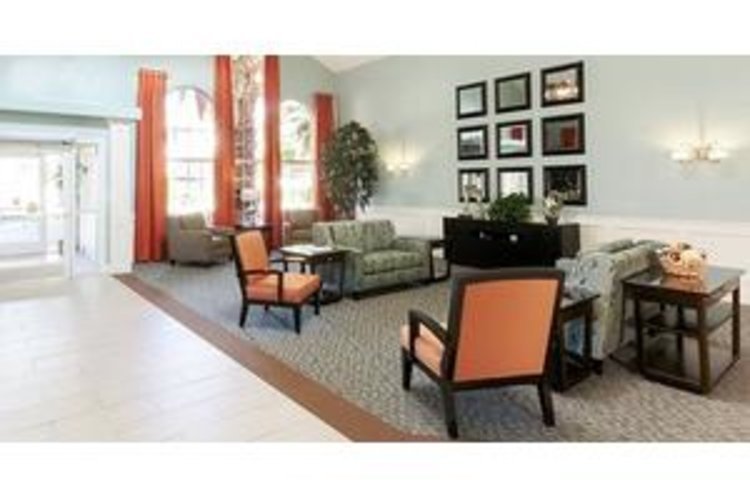
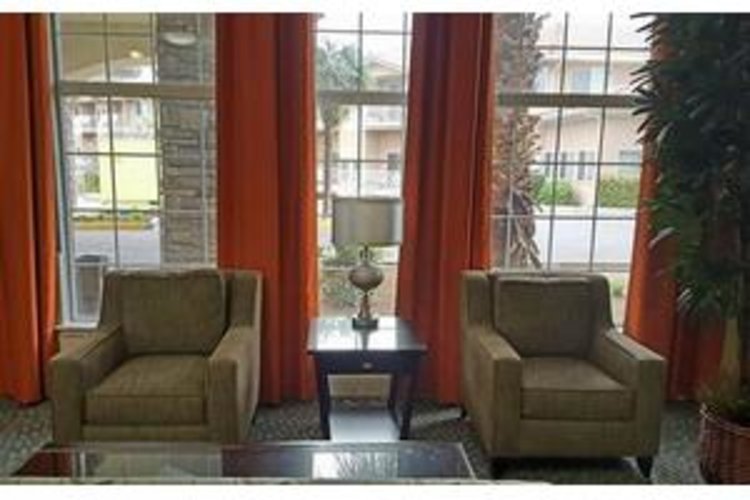
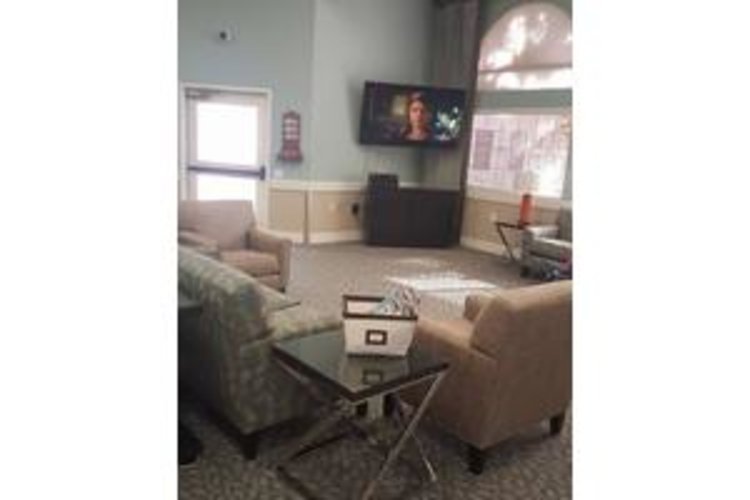
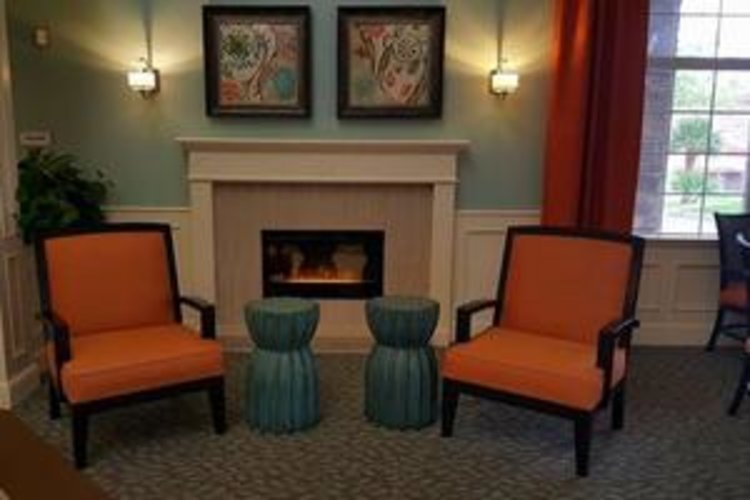
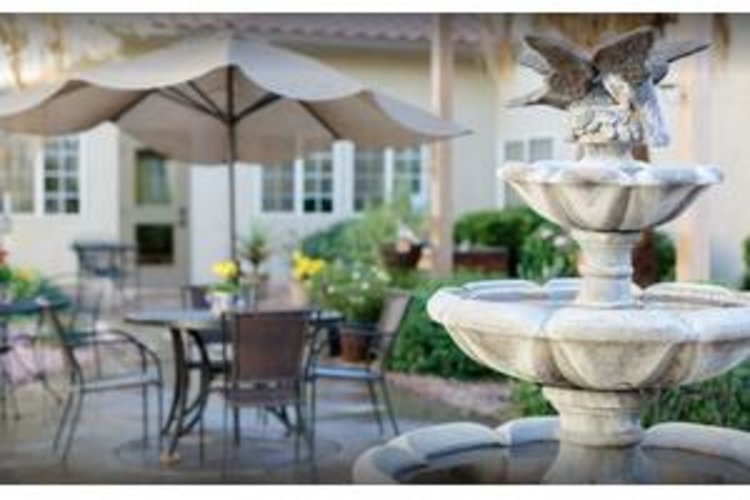
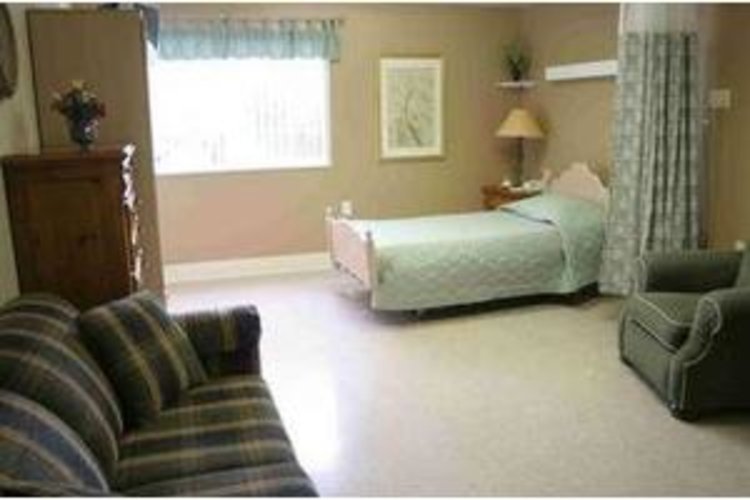
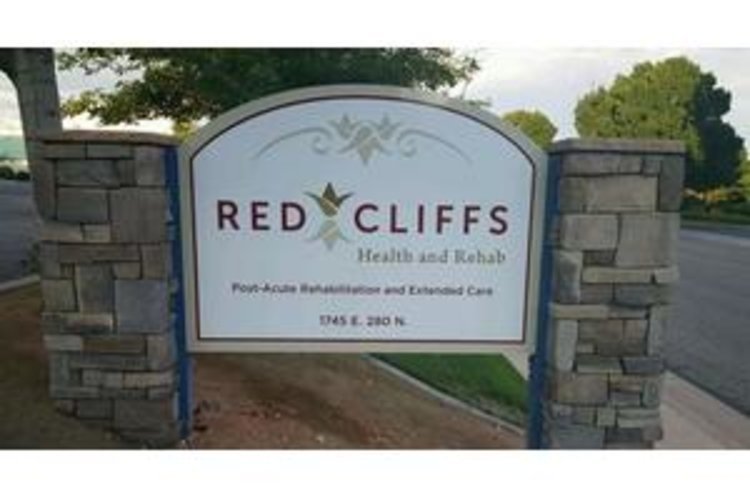
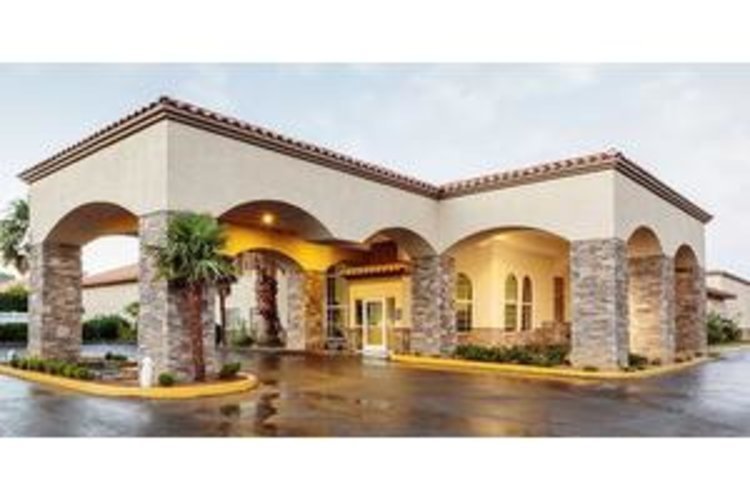
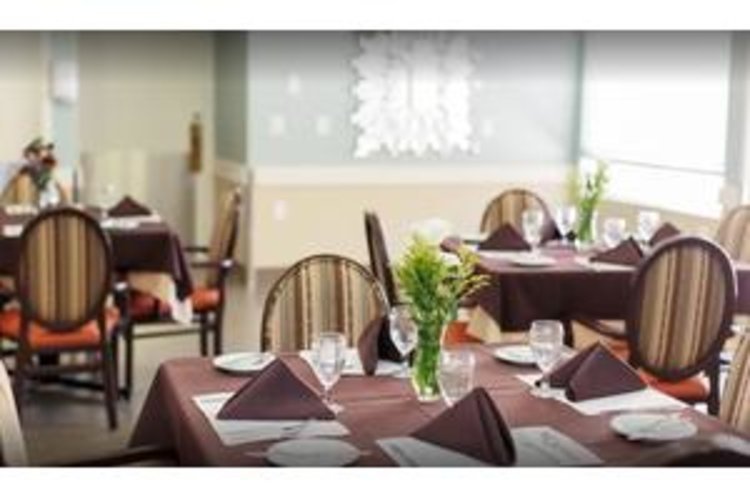
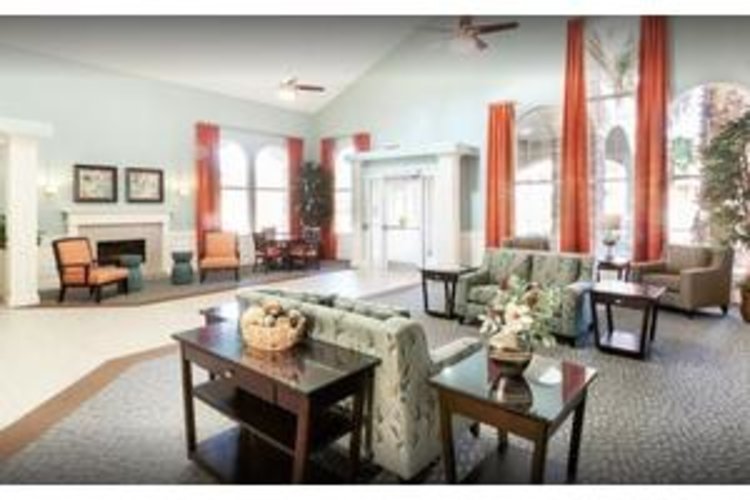
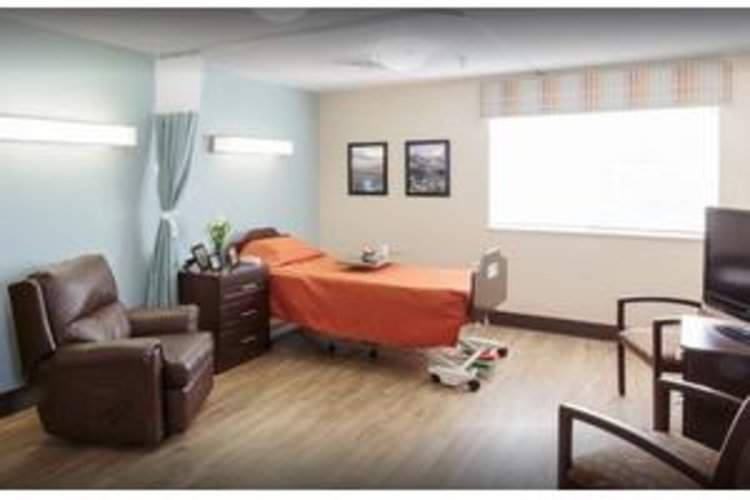
Red Cliffs Health and Rehab is a senior living community that provides skilled nursing services and in short term and long term rehabilitation for residents. Red Cliffs Health and Rehab is located in St. George, UT, giving residents the opportunity to live and recover in a state-of-the-art facility with a backdrop of the beautiful red rock country of Southern Utah.
Contact for available floor plans
Contact for available Payment Options
DEMOGRAPHIC BREAKDOWN
30%
Single
Marital Status
60%
Married Couples
Community
76%
Drove By Themselves
Commute
3%
Below 9th Grade
Highest Level of Education
35%
Children
Adult vs. Children
17%
0-9
Population by Age
17%
0-9
Males by Age Distribution
16%
0-9
Females by Age Distribution
Males by Age Distribution
Status | Percentage |
---|---|
0-9 | 17% |
10-19 | 16% |
20-29 | 15% |
30-39 | 14% |
40-49 | 11% |
50-59 | 9% |
60-69 | 8% |
70-79 | 8% |
80 Above | 2% |
Females by Age Distribution
Status | Percentage |
---|---|
0-9 | 16% |
10-19 | 16% |
20-29 | 15% |
30-39 | 14% |
40-49 | 11% |
50-59 | 10% |
60-69 | 8% |
70-79 | 8% |
80 Above | 3% |
Marital Status
Status | Percentage |
---|---|
Single | 30% |
Married (Not Separated) | 55% |
Separated | 2% |
Widowed | 4% |
Divorced | 9% |
Community
Status | Percentage |
---|---|
Married Couples | 60% |
Single Females | 9% |
Single Males | 4% |
Living Alone | 7% |
Living With Family | 20% |
Commute
Status | Percentage |
---|---|
Drove By Themselves | 76% |
Public Transportation | 2% |
Carpooled | 12% |
Walked | 3% |
Occasional Drive | 0% |
Work At Home | 5% |
Other | 2% |
Highest Level of Education
Status | Percentage |
---|---|
Below 9th Grade | 3% |
Bachelors Degree | 20% |
High School | 23% |
College | 28% |
Associate Degree | 10% |
9th to 12th Grade | 6% |
Graduate | 10% |
Adult vs. Children
Status | Percentage |
---|---|
Children | 35% |
Adult | 65% |
Population by Age
Status | Percentage |
---|---|
0-9 | 17% |
10-19 | 17% |
20-29 | 15% |
30-39 | 15% |
40-49 | 11% |
50-59 | 10% |
60-69 | 8% |
70-79 | 4% |
80 Above | 2% |
Males by Age Distribution
Status | Percentage |
---|---|
0-9 | 17% |
10-19 | 16% |
20-29 | 15% |
30-39 | 14% |
40-49 | 11% |
50-59 | 9% |
60-69 | 8% |
70-79 | 8% |
80 Above | 2% |
Females by Age Distribution
Status | Percentage |
---|---|
0-9 | 16% |
10-19 | 16% |
20-29 | 15% |
30-39 | 14% |
40-49 | 11% |
50-59 | 10% |
60-69 | 8% |
70-79 | 8% |
80 Above | 3% |