32.4703
-86.4274
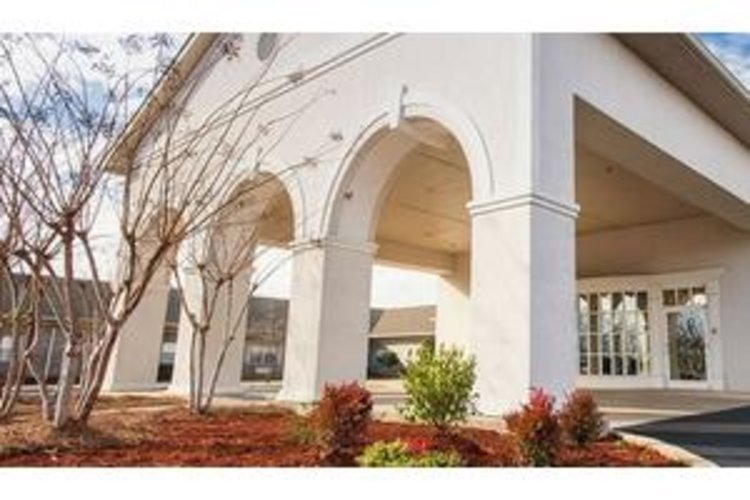
Prattville Health and Rehabilitation
$ Call for Rates
601 JASMINE TRAIL, Prattville, AL 36066
$ Call for Rates
601 JASMINE TRAIL, Prattville, AL 36066
Care Types: Nursing Care
Prattville Health and Rehabilitation is in the north east of Prattville, AL in a residential area. The town has several parks where residents can stretch their legs and restaurants where residents can go to with visiting loved ones. Health care amenities nearby include Prattville Baptist Hospital and Prattville Medical Clinic.
Prattville Health and Rehabilitation offers skilled nursing, memory care and rehabilitation. Services include pain management, IV therapy and cardiac recovery, in addition to physical, speech and occupational therapy. Caregivers provide 24/7 support and assistance as well as housekeeping and laundry services. …. SHOW MORE
Residents can make the most of the fully equipped gym and therapy room or soak up the sun in the secure patio area. Professional staff lead daily activities designed to nourish body, mind and soul, including bingo, music therapy and chair yoga. The culinary team prepares three nutritious meals per day.
SHOW LESS
31%
Single
Marital Status
46%
Married Couples
Community
85%
Drove By Themselves
Commute
5%
Below 9th Grade
Highest Level of Education
27%
Children
Adult vs. Children
12%
0-9
Population by Age
12%
0-9
Males by Age Distribution
11%
0-9
Females by Age Distribution
| Status | Percentage |
|---|---|
| 0-9 | 12% |
| 10-19 | 13% |
| 20-29 | 13% |
| 30-39 | 12% |
| 40-49 | 12% |
| 50-59 | 13% |
| 60-69 | 11% |
| 70-79 | 13% |
| 80 Above | 3% |
| Status | Percentage |
|---|---|
| 0-9 | 11% |
| 10-19 | 12% |
| 20-29 | 12% |
| 30-39 | 12% |
| 40-49 | 12% |
| 50-59 | 13% |
| 60-69 | 11% |
| 70-79 | 12% |
| 80 Above | 4% |
| Status | Percentage |
|---|---|
| Single | 31% |
| Married (Not Separated) | 47% |
| Separated | 3% |
| Widowed | 7% |
| Divorced | 13% |
| Status | Percentage |
|---|---|
| Married Couples | 46% |
| Single Females | 15% |
| Single Males | 4% |
| Living Alone | 10% |
| Living With Family | 26% |
| Status | Percentage |
|---|---|
| Drove By Themselves | 85% |
| Public Transportation | 0% |
| Carpooled | 9% |
| Walked | 1% |
| Occasional Drive | 0% |
| Work At Home | 3% |
| Other | 1% |
| Status | Percentage |
|---|---|
| Below 9th Grade | 5% |
| Bachelors Degree | 14% |
| High School | 31% |
| College | 22% |
| Associate Degree | 8% |
| 9th to 12th Grade | 11% |
| Graduate | 9% |
| Status | Percentage |
|---|---|
| Children | 27% |
| Adult | 73% |
| Status | Percentage |
|---|---|
| 0-9 | 12% |
| 10-19 | 14% |
| 20-29 | 13% |
| 30-39 | 13% |
| 40-49 | 13% |
| 50-59 | 14% |
| 60-69 | 12% |
| 70-79 | 7% |
| 80 Above | 4% |
| Status | Percentage |
|---|---|
| 0-9 | 12% |
| 10-19 | 13% |
| 20-29 | 13% |
| 30-39 | 12% |
| 40-49 | 12% |
| 50-59 | 13% |
| 60-69 | 11% |
| 70-79 | 13% |
| 80 Above | 3% |
| Status | Percentage |
|---|---|
| 0-9 | 11% |
| 10-19 | 12% |
| 20-29 | 12% |
| 30-39 | 12% |
| 40-49 | 12% |
| 50-59 | 13% |
| 60-69 | 11% |
| 70-79 | 12% |
| 80 Above | 4% |
By clicking “Request Info” you agree to our Terms of Use and Privacy Policy. You also consent to receive texts and calls, which may be autodialed, from us and our partner providers; however, your consent is not a condition to using our service.

By clicking “Request Info”, you agree to our Terms of Use, our Privacy Policy, and our Agreement to be Contacted by Telephone. You also consent that we, or our partner providers, may reach out to you about senior living solutions or Medicare insurance using a system that can auto-dial; however, you do not need to consent to this to use our service.