43.6667
-70.2839
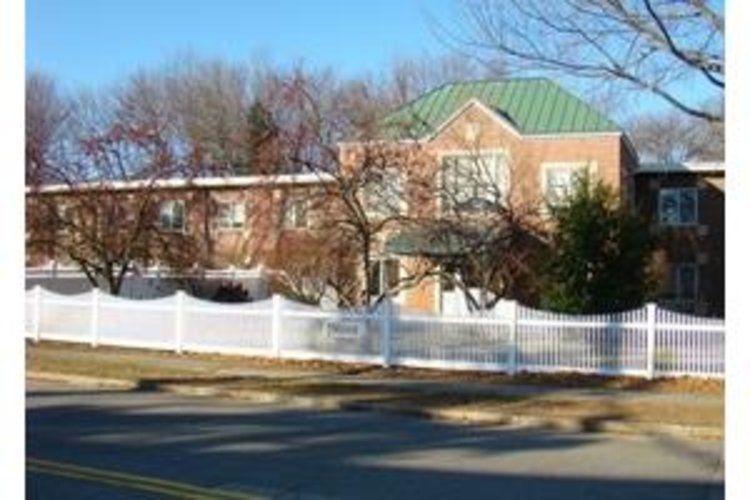
Portland Center for Assisted Living
$ Call for Rates
68 Devonshire Street, Portland, ME 04103
$ Call for Rates
68 Devonshire Street, Portland, ME 04103

29%
Single
Marital Status
47%
Married Couples
Community
78%
Drove By Themselves
Commute
3%
Below 9th Grade
Highest Level of Education
23%
Children
Adult vs. Children
10%
0-9
Population by Age
10%
0-9
Males by Age Distribution
9%
0-9
Females by Age Distribution
| Status | Percentage |
|---|---|
| 0-9 | 10% |
| 10-19 | 12% |
| 20-29 | 11% |
| 30-39 | 10% |
| 40-49 | 12% |
| 50-59 | 15% |
| 60-69 | 13% |
| 70-79 | 15% |
| 80 Above | 3% |
| Status | Percentage |
|---|---|
| 0-9 | 9% |
| 10-19 | 10% |
| 20-29 | 11% |
| 30-39 | 10% |
| 40-49 | 12% |
| 50-59 | 15% |
| 60-69 | 13% |
| 70-79 | 14% |
| 80 Above | 5% |
| Status | Percentage |
|---|---|
| Single | 29% |
| Married (Not Separated) | 50% |
| Separated | 1% |
| Widowed | 7% |
| Divorced | 14% |
| Status | Percentage |
|---|---|
| Married Couples | 47% |
| Single Females | 9% |
| Single Males | 4% |
| Living Alone | 11% |
| Living With Family | 28% |
| Status | Percentage |
|---|---|
| Drove By Themselves | 78% |
| Public Transportation | 1% |
| Carpooled | 10% |
| Walked | 4% |
| Occasional Drive | 0% |
| Work At Home | 5% |
| Other | 2% |
| Status | Percentage |
|---|---|
| Below 9th Grade | 3% |
| Bachelors Degree | 18% |
| High School | 34% |
| College | 20% |
| Associate Degree | 9% |
| 9th to 12th Grade | 5% |
| Graduate | 10% |
| Status | Percentage |
|---|---|
| Children | 23% |
| Adult | 77% |
| Status | Percentage |
|---|---|
| 0-9 | 10% |
| 10-19 | 12% |
| 20-29 | 11% |
| 30-39 | 11% |
| 40-49 | 13% |
| 50-59 | 16% |
| 60-69 | 14% |
| 70-79 | 8% |
| 80 Above | 5% |
| Status | Percentage |
|---|---|
| 0-9 | 10% |
| 10-19 | 12% |
| 20-29 | 11% |
| 30-39 | 10% |
| 40-49 | 12% |
| 50-59 | 15% |
| 60-69 | 13% |
| 70-79 | 15% |
| 80 Above | 3% |
| Status | Percentage |
|---|---|
| 0-9 | 9% |
| 10-19 | 10% |
| 20-29 | 11% |
| 30-39 | 10% |
| 40-49 | 12% |
| 50-59 | 15% |
| 60-69 | 13% |
| 70-79 | 14% |
| 80 Above | 5% |
By clicking “Request Info” you agree to our Terms of Use and Privacy Policy. You also consent to receive texts and calls, which may be autodialed, from us and our partner providers; however, your consent is not a condition to using our service.

By clicking “Request Info”, you agree to our Terms of Use, our Privacy Policy, and our Agreement to be Contacted by Telephone. You also consent that we, or our partner providers, may reach out to you about senior living solutions or Medicare insurance using a system that can auto-dial; however, you do not need to consent to this to use our service.