43.0153
-123.291
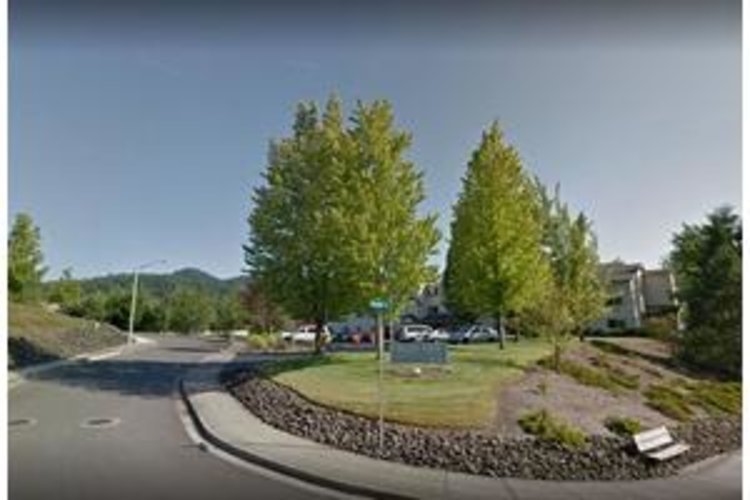
Plaza Retirement Community
$ Call for Rates
265 Plaza Dr, Myrtle Creek, OR 97457
$ Call for Rates
265 Plaza Dr, Myrtle Creek, OR 97457
Care Types: Assisted Living, Retirement
Welcome to Plaza Retirement Community! Plaza Retirement Community provides quality affordable housing to seniors, and is located in Myrtle Creek, Oregon, which is small in size but big on community spirit. Myrtle Creek offers Plaza Retirement Community residents a warm welcome and the opportunity to be involved in community activities. Located across the street from Valley View Retirement Center and within walking distance of shopping areas, Plaza residents benefit from the genuine, rural friendliness of the area.
Plaza Retirement Community is a clean, comfortable, and secure three-story building with an elevator, indoor mailboxes, in-house laundry facilities, and locked exterior doors. Air conditioned apartments feature fire sprinklers and emergency pull cords. Amenities include an internet connected Wi-Fi resident computer, a pet area, and a community room for games, parties, and other activities. A management team oversees daily operations and routine maintenance. We are a smoke-free community. …. SHOW MORE

31%
Single
Marital Status
48%
Married Couples
Community
71%
Drove By Themselves
Commute
4%
Below 9th Grade
Highest Level of Education
25%
Children
Adult vs. Children
12%
0-9
Population by Age
11%
0-9
Males by Age Distribution
11%
0-9
Females by Age Distribution
| Status | Percentage |
|---|---|
| 0-9 | 11% |
| 10-19 | 12% |
| 20-29 | 13% |
| 30-39 | 13% |
| 40-49 | 12% |
| 50-59 | 12% |
| 60-69 | 12% |
| 70-79 | 12% |
| 80 Above | 3% |
| Status | Percentage |
|---|---|
| 0-9 | 11% |
| 10-19 | 11% |
| 20-29 | 12% |
| 30-39 | 13% |
| 40-49 | 11% |
| 50-59 | 13% |
| 60-69 | 12% |
| 70-79 | 12% |
| 80 Above | 4% |
| Status | Percentage |
|---|---|
| Single | 31% |
| Married (Not Separated) | 49% |
| Separated | 2% |
| Widowed | 5% |
| Divorced | 13% |
| Status | Percentage |
|---|---|
| Married Couples | 48% |
| Single Females | 11% |
| Single Males | 4% |
| Living Alone | 10% |
| Living With Family | 27% |
| Status | Percentage |
|---|---|
| Drove By Themselves | 71% |
| Public Transportation | 4% |
| Carpooled | 10% |
| Walked | 4% |
| Occasional Drive | 0% |
| Work At Home | 6% |
| Other | 3% |
| Status | Percentage |
|---|---|
| Below 9th Grade | 4% |
| Bachelors Degree | 19% |
| High School | 25% |
| College | 27% |
| Associate Degree | 8% |
| 9th to 12th Grade | 6% |
| Graduate | 11% |
| Status | Percentage |
|---|---|
| Children | 25% |
| Adult | 75% |
| Status | Percentage |
|---|---|
| 0-9 | 12% |
| 10-19 | 13% |
| 20-29 | 13% |
| 30-39 | 14% |
| 40-49 | 12% |
| 50-59 | 13% |
| 60-69 | 13% |
| 70-79 | 7% |
| 80 Above | 4% |
| Status | Percentage |
|---|---|
| 0-9 | 11% |
| 10-19 | 12% |
| 20-29 | 13% |
| 30-39 | 13% |
| 40-49 | 12% |
| 50-59 | 12% |
| 60-69 | 12% |
| 70-79 | 12% |
| 80 Above | 3% |
| Status | Percentage |
|---|---|
| 0-9 | 11% |
| 10-19 | 11% |
| 20-29 | 12% |
| 30-39 | 13% |
| 40-49 | 11% |
| 50-59 | 13% |
| 60-69 | 12% |
| 70-79 | 12% |
| 80 Above | 4% |
By clicking “Request Info” you agree to our Terms of Use and Privacy Policy. You also consent to receive texts and calls, which may be autodialed, from us and our partner providers; however, your consent is not a condition to using our service.

By clicking “Request Info”, you agree to our Terms of Use, our Privacy Policy, and our Agreement to be Contacted by Telephone. You also consent that we, or our partner providers, may reach out to you about senior living solutions or Medicare insurance using a system that can auto-dial; however, you do not need to consent to this to use our service.