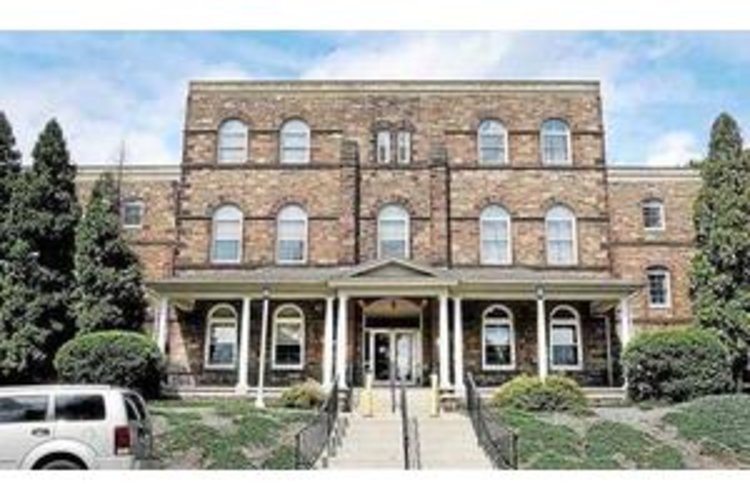


Parkhouse Nursing & Rehabilitation Center
$ Call for Rates
1600 Black Rock Rd, Royersford, PA 19468
Overview
Care Types: Nursing Care
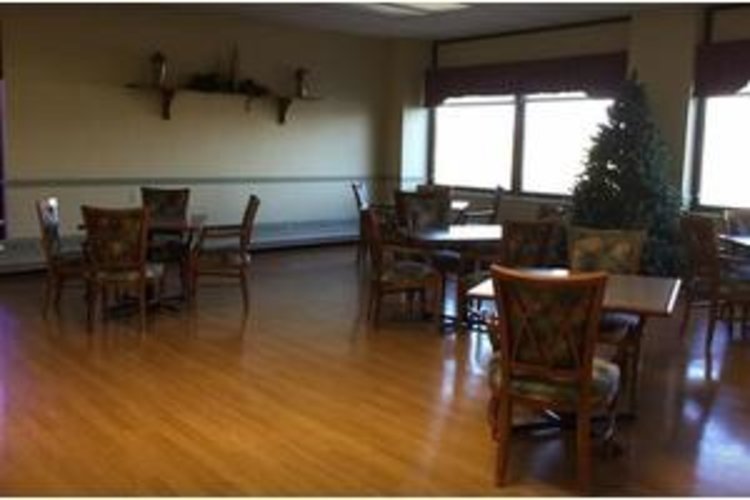
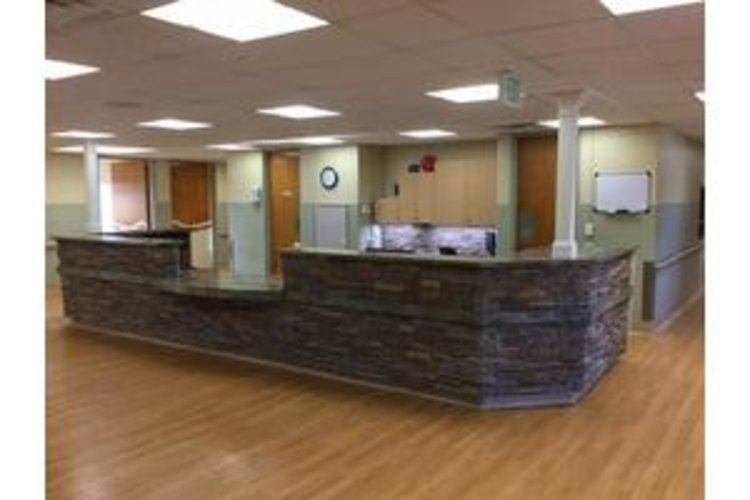
Welcome to Parkhouse Nursing & Rehab Center! At Parkhouse Nursing & Rehabilitation Center, our team is committed to providing the highest quality geriatric care, including rehabilitation services, skilled nursing services, long-term care, hospice care, and an adult day program. Our patients receive physical and occupational therapy services in our newly renovated rehabilitation gym, with the assistance of our exceptional staff.
Contact for available floor plans
Contact for available Payment Options
Neighborhood & Demographics

DEMOGRAPHIC BREAKDOWN
34%
Single
Marital Status
46%
Married Couples
Community
77%
Drove By Themselves
Commute
4%
Below 9th Grade
Highest Level of Education
25%
Children
Adult vs. Children
11%
0-9
Population by Age
11%
0-9
Males by Age Distribution
10%
0-9
Females by Age Distribution
Males by Age Distribution
| Status | Percentage |
|---|---|
| 0-9 | 11% |
| 10-19 | 12% |
| 20-29 | 13% |
| 30-39 | 11% |
| 40-49 | 12% |
| 50-59 | 14% |
| 60-69 | 11% |
| 70-79 | 13% |
| 80 Above | 3% |
Females by Age Distribution
| Status | Percentage |
|---|---|
| 0-9 | 10% |
| 10-19 | 11% |
| 20-29 | 12% |
| 30-39 | 11% |
| 40-49 | 12% |
| 50-59 | 14% |
| 60-69 | 12% |
| 70-79 | 13% |
| 80 Above | 6% |
Marital Status
| Status | Percentage |
|---|---|
| Single | 34% |
| Married (Not Separated) | 48% |
| Separated | 2% |
| Widowed | 7% |
| Divorced | 10% |
Community
| Status | Percentage |
|---|---|
| Married Couples | 46% |
| Single Females | 11% |
| Single Males | 4% |
| Living Alone | 11% |
| Living With Family | 27% |
Commute
| Status | Percentage |
|---|---|
| Drove By Themselves | 77% |
| Public Transportation | 5% |
| Carpooled | 9% |
| Walked | 4% |
| Occasional Drive | 0% |
| Work At Home | 4% |
| Other | 1% |
Highest Level of Education
| Status | Percentage |
|---|---|
| Below 9th Grade | 4% |
| Bachelors Degree | 17% |
| High School | 37% |
| College | 16% |
| Associate Degree | 8% |
| 9th to 12th Grade | 7% |
| Graduate | 11% |
Adult vs. Children
| Status | Percentage |
|---|---|
| Children | 25% |
| Adult | 75% |
Population by Age
| Status | Percentage |
|---|---|
| 0-9 | 11% |
| 10-19 | 13% |
| 20-29 | 13% |
| 30-39 | 12% |
| 40-49 | 13% |
| 50-59 | 15% |
| 60-69 | 12% |
| 70-79 | 7% |
| 80 Above | 5% |
Males by Age Distribution
| Status | Percentage |
|---|---|
| 0-9 | 11% |
| 10-19 | 12% |
| 20-29 | 13% |
| 30-39 | 11% |
| 40-49 | 12% |
| 50-59 | 14% |
| 60-69 | 11% |
| 70-79 | 13% |
| 80 Above | 3% |
Females by Age Distribution
| Status | Percentage |
|---|---|
| 0-9 | 10% |
| 10-19 | 11% |
| 20-29 | 12% |
| 30-39 | 11% |
| 40-49 | 12% |
| 50-59 | 14% |
| 60-69 | 12% |
| 70-79 | 13% |
| 80 Above | 6% |
