Pacifica Nursing and Rehab Center
$ Call for Rates
385 ESPLANADE AVE, Pacifica, CA 94044
Overview
Care Types: Nursing Care
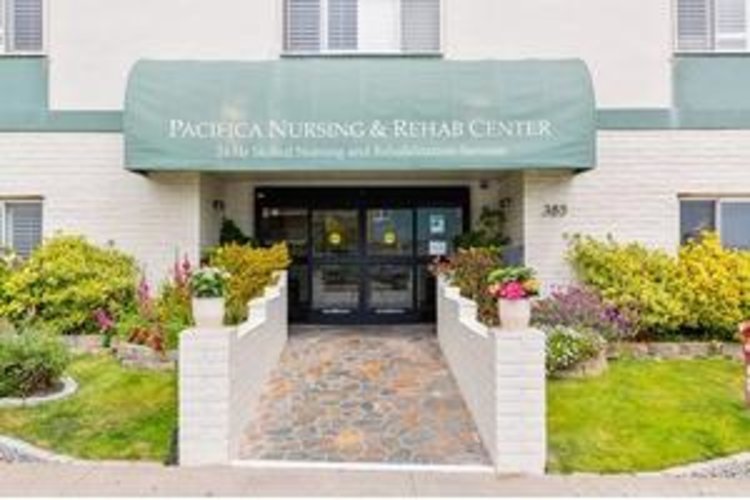
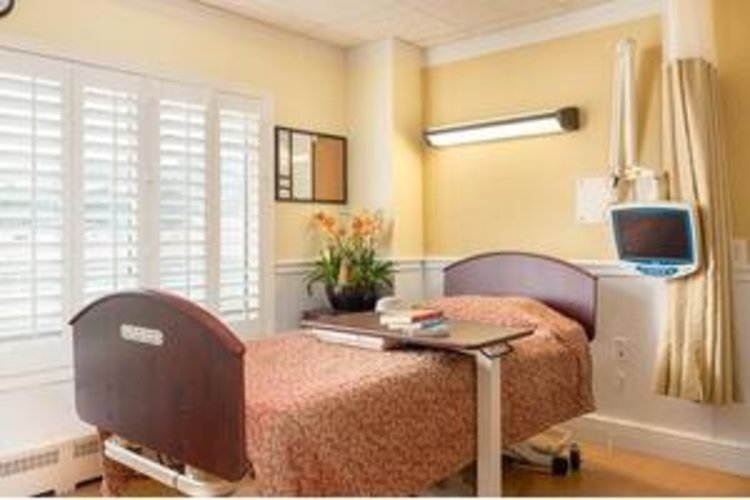
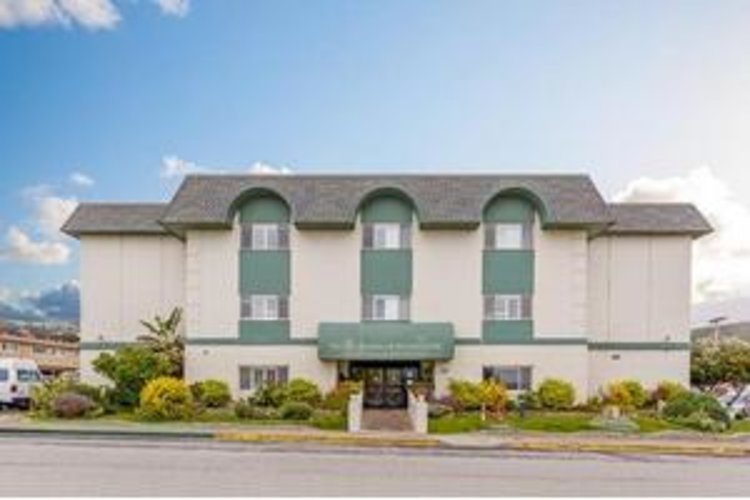
Located on a street bordering the majestic Pacific Ocean, Pacifica Nursing and Rehabilitation Center is a simple square design, sturdily constructed to weather the occasional storms that are characteristic of the area. The Center is usually a hub of activity, as many patients require only short-term rehabilitation. The Center also provides services on an outpatient basis, with a focus on physical, occupational and speech therapies. The outpatient services can indirectly benefit the facility’s residents. One benefit is that the age range of patients is greater than usual. Another is access to the specialized rehabilitative equipment. Because it is available in a physical fitness or recreational milieu, many residents are motivated to make use of it.
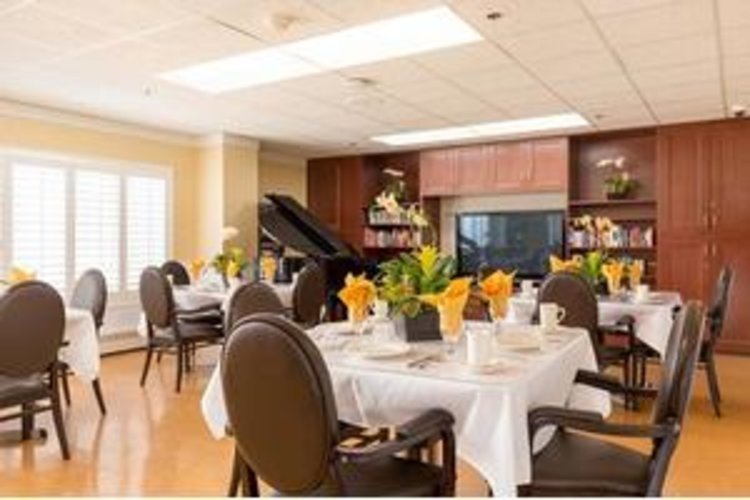
A wide range of additional activities including dancing, facilitated discussion groups, and arts and crafts are provided seven days a week. A number of activities are held in the evenings, encouraging residents to stay active. At least seven activities are presented each day for residents to choose from. The Center focuses on its activities, as well as its caring staff, to help the residents feel “at home” for whatever length of time they remain. …. SHOW MORE
The facility is accredited by the Joint Commission on Accreditation of Healthcare Organizations and the staff takes great pride in the success of their treatments. These may be two indications why Kaiser patients ranked Pacifica Nursing and Rehabilitation number one in overall customer satisfaction in 2003.
SHOW LESSAmenities
- English Language
- Tagalog Language
- Guests Allowed at Meal Time
- On-site Resident Parking
- Outdoor Patios and Gardens
Contact for available floor plans
Contact for available Payment Options
Neighborhood & Demographics
DEMOGRAPHIC BREAKDOWN
37%
Single
Marital Status
48%
Married Couples
Community
73%
Drove By Themselves
Commute
10%
Below 9th Grade
Highest Level of Education
28%
Children
Adult vs. Children
13%
0-9
Population by Age
13%
0-9
Males by Age Distribution
12%
0-9
Females by Age Distribution
Males by Age Distribution
Status | Percentage |
---|---|
0-9 | 13% |
10-19 | 13% |
20-29 | 15% |
30-39 | 13% |
40-49 | 13% |
50-59 | 12% |
60-69 | 9% |
70-79 | 10% |
80 Above | 3% |
Females by Age Distribution
Status | Percentage |
---|---|
0-9 | 12% |
10-19 | 12% |
20-29 | 14% |
30-39 | 13% |
40-49 | 13% |
50-59 | 13% |
60-69 | 10% |
70-79 | 10% |
80 Above | 4% |
Marital Status
Status | Percentage |
---|---|
Single | 37% |
Married (Not Separated) | 46% |
Separated | 2% |
Widowed | 5% |
Divorced | 10% |
Community
Status | Percentage |
---|---|
Married Couples | 48% |
Single Females | 13% |
Single Males | 6% |
Living Alone | 8% |
Living With Family | 25% |
Commute
Status | Percentage |
---|---|
Drove By Themselves | 73% |
Public Transportation | 5% |
Carpooled | 11% |
Walked | 3% |
Occasional Drive | 0% |
Work At Home | 5% |
Other | 2% |
Highest Level of Education
Status | Percentage |
---|---|
Below 9th Grade | 10% |
Bachelors Degree | 20% |
High School | 21% |
College | 22% |
Associate Degree | 8% |
9th to 12th Grade | 8% |
Graduate | 11% |
Adult vs. Children
Status | Percentage |
---|---|
Children | 28% |
Adult | 72% |
Population by Age
Status | Percentage |
---|---|
0-9 | 13% |
10-19 | 14% |
20-29 | 14% |
30-39 | 14% |
40-49 | 13% |
50-59 | 13% |
60-69 | 10% |
70-79 | 5% |
80 Above | 3% |
Males by Age Distribution
Status | Percentage |
---|---|
0-9 | 13% |
10-19 | 13% |
20-29 | 15% |
30-39 | 13% |
40-49 | 13% |
50-59 | 12% |
60-69 | 9% |
70-79 | 10% |
80 Above | 3% |
Females by Age Distribution
Status | Percentage |
---|---|
0-9 | 12% |
10-19 | 12% |
20-29 | 14% |
30-39 | 13% |
40-49 | 13% |
50-59 | 13% |
60-69 | 10% |
70-79 | 10% |
80 Above | 4% |