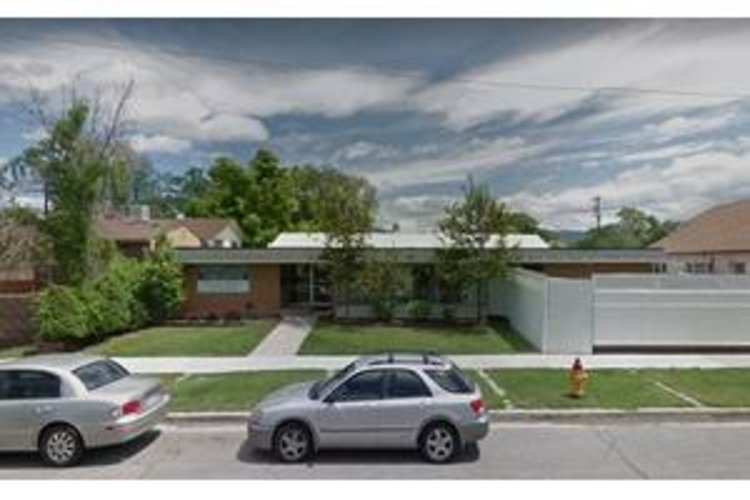
Midtown Manor
$ Call for Rates
125 SOUTH 900 WEST, Salt Lake City, UT 84104
Overview
Care Types: Nursing Care, Assisted Living
Midtown Manor has been providing the Salt Lake City area with tender, professional nursing care since 1988. Our nursing home's services include long-term care and rehabilitation. Midtown Manor understands how important your loved ones are to you and will give them the care they deserve.
Midtown Manor is a long-term-care nursing facility located in Salt Lake City, Utah. We are licensed by the State of Utah Department of Health. Our facility has 82 beds, and we welcome Medicare, Medicaid, veteran, private, and hospice residents. There is also a special unit for those with Alzheimer's Disease, and special care and support for the hospice residents. At Midtown Manor, the facility medical director oversees the ongoing plans of care for each resident. In addition to the 24-hour nursing care provided each day, the facility also offers many other services.
Contact for available floor plans
Contact for available Payment Options
DEMOGRAPHIC BREAKDOWN
30%
Single
Marital Status
60%
Married Couples
Community
76%
Drove By Themselves
Commute
3%
Below 9th Grade
Highest Level of Education
35%
Children
Adult vs. Children
17%
0-9
Population by Age
17%
0-9
Males by Age Distribution
16%
0-9
Females by Age Distribution
Males by Age Distribution
Status | Percentage |
---|---|
0-9 | 17% |
10-19 | 16% |
20-29 | 15% |
30-39 | 14% |
40-49 | 11% |
50-59 | 9% |
60-69 | 8% |
70-79 | 8% |
80 Above | 2% |
Females by Age Distribution
Status | Percentage |
---|---|
0-9 | 16% |
10-19 | 16% |
20-29 | 15% |
30-39 | 14% |
40-49 | 11% |
50-59 | 10% |
60-69 | 8% |
70-79 | 8% |
80 Above | 3% |
Marital Status
Status | Percentage |
---|---|
Single | 30% |
Married (Not Separated) | 55% |
Separated | 2% |
Widowed | 4% |
Divorced | 9% |
Community
Status | Percentage |
---|---|
Married Couples | 60% |
Single Females | 9% |
Single Males | 4% |
Living Alone | 7% |
Living With Family | 20% |
Commute
Status | Percentage |
---|---|
Drove By Themselves | 76% |
Public Transportation | 2% |
Carpooled | 12% |
Walked | 3% |
Occasional Drive | 0% |
Work At Home | 5% |
Other | 2% |
Highest Level of Education
Status | Percentage |
---|---|
Below 9th Grade | 3% |
Bachelors Degree | 20% |
High School | 23% |
College | 28% |
Associate Degree | 10% |
9th to 12th Grade | 6% |
Graduate | 10% |
Adult vs. Children
Status | Percentage |
---|---|
Children | 35% |
Adult | 65% |
Population by Age
Status | Percentage |
---|---|
0-9 | 17% |
10-19 | 17% |
20-29 | 15% |
30-39 | 15% |
40-49 | 11% |
50-59 | 10% |
60-69 | 8% |
70-79 | 4% |
80 Above | 2% |
Males by Age Distribution
Status | Percentage |
---|---|
0-9 | 17% |
10-19 | 16% |
20-29 | 15% |
30-39 | 14% |
40-49 | 11% |
50-59 | 9% |
60-69 | 8% |
70-79 | 8% |
80 Above | 2% |
Females by Age Distribution
Status | Percentage |
---|---|
0-9 | 16% |
10-19 | 16% |
20-29 | 15% |
30-39 | 14% |
40-49 | 11% |
50-59 | 10% |
60-69 | 8% |
70-79 | 8% |
80 Above | 3% |