Luther Towers Of Dover
$ Call for Rates
430Kings Hwy NE #727, Dover, DE 19901
Overview
Care Types: Retirement, Independent Living
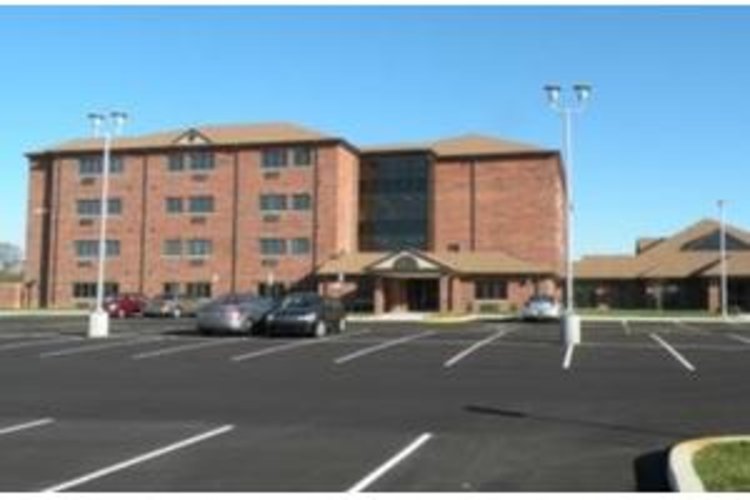
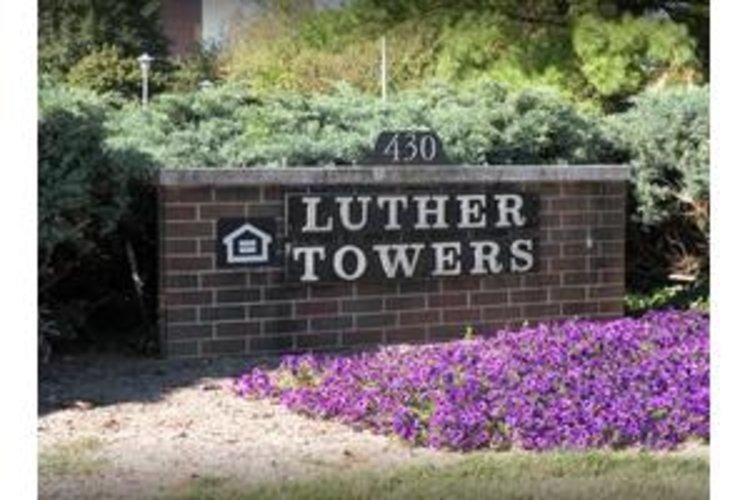
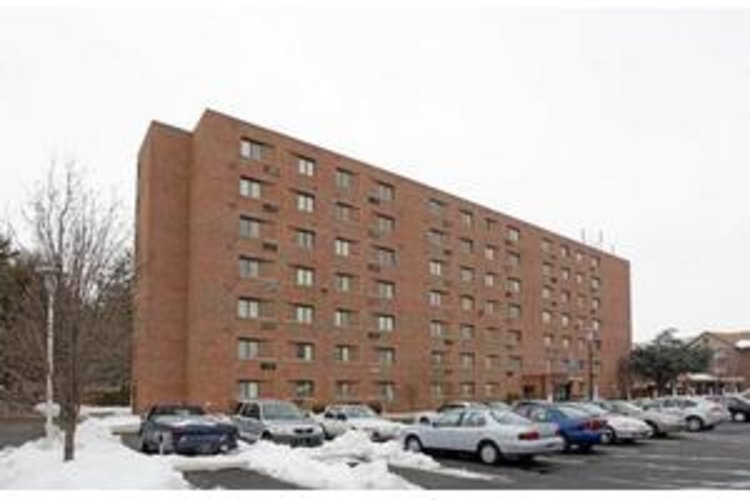
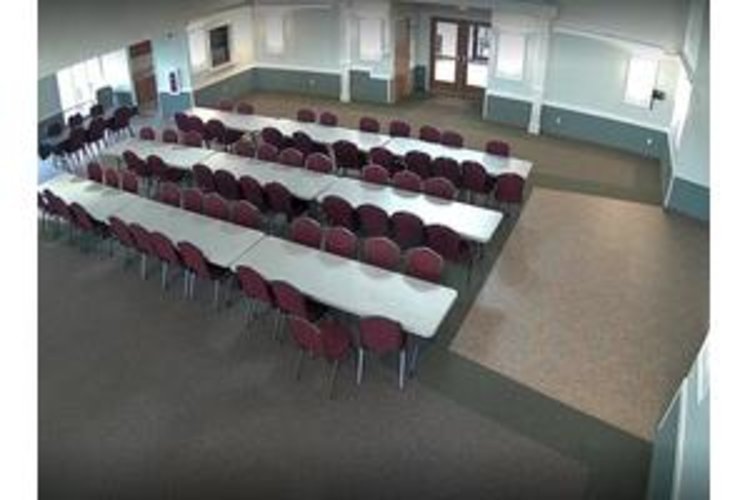
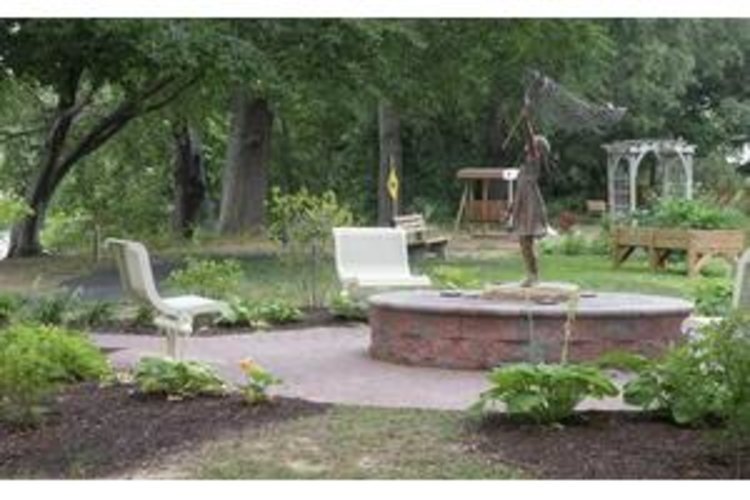
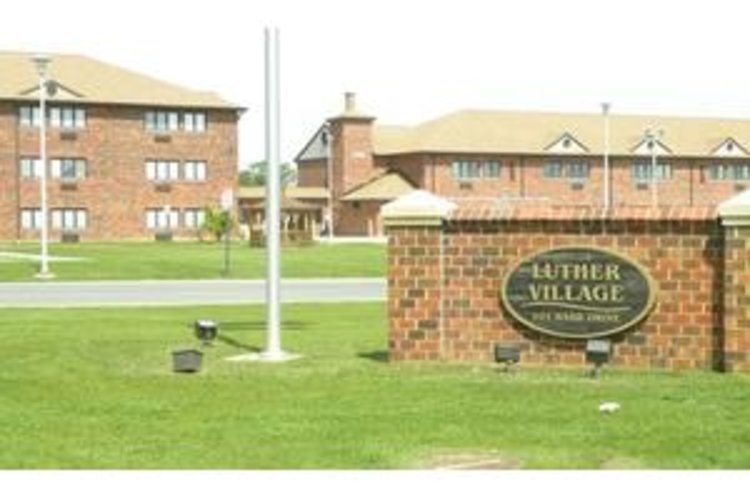
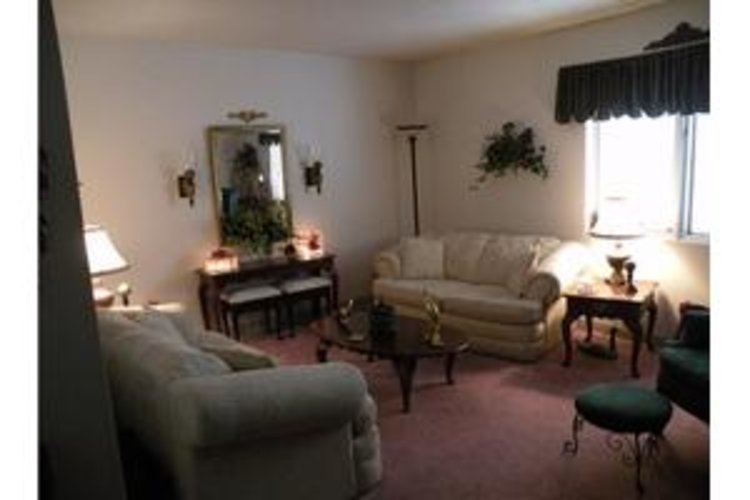
Welcome to Luther Towers Of Dover! Luther Towers and Luther Village of Dover are operated under the guidelines established by the U.S. Department of Housing and Urban Development Section 202/8 programs. Luther Towers and Luther Village are apartment campuses for Seniors 62 and older.
Contact for available floor plans
Contact for available Payment Options
DEMOGRAPHIC BREAKDOWN
34%
Single
Marital Status
46%
Married Couples
Community
81%
Drove By Themselves
Commute
4%
Below 9th Grade
Highest Level of Education
26%
Children
Adult vs. Children
11%
0-9
Population by Age
11%
0-9
Males by Age Distribution
10%
0-9
Females by Age Distribution
Males by Age Distribution
Status | Percentage |
---|---|
0-9 | 11% |
10-19 | 13% |
20-29 | 13% |
30-39 | 12% |
40-49 | 11% |
50-59 | 13% |
60-69 | 11% |
70-79 | 14% |
80 Above | 3% |
Females by Age Distribution
Status | Percentage |
---|---|
0-9 | 10% |
10-19 | 11% |
20-29 | 12% |
30-39 | 11% |
40-49 | 11% |
50-59 | 14% |
60-69 | 12% |
70-79 | 13% |
80 Above | 4% |
Marital Status
Status | Percentage |
---|---|
Single | 34% |
Married (Not Separated) | 47% |
Separated | 2% |
Widowed | 6% |
Divorced | 11% |
Community
Status | Percentage |
---|---|
Married Couples | 46% |
Single Females | 13% |
Single Males | 5% |
Living Alone | 10% |
Living With Family | 27% |
Commute
Status | Percentage |
---|---|
Drove By Themselves | 81% |
Public Transportation | 3% |
Carpooled | 9% |
Walked | 2% |
Occasional Drive | 0% |
Work At Home | 4% |
Other | 1% |
Highest Level of Education
Status | Percentage |
---|---|
Below 9th Grade | 4% |
Bachelors Degree | 17% |
High School | 32% |
College | 20% |
Associate Degree | 7% |
9th to 12th Grade | 8% |
Graduate | 12% |
Adult vs. Children
Status | Percentage |
---|---|
Children | 26% |
Adult | 74% |
Population by Age
Status | Percentage |
---|---|
0-9 | 11% |
10-19 | 14% |
20-29 | 13% |
30-39 | 12% |
40-49 | 12% |
50-59 | 14% |
60-69 | 12% |
70-79 | 7% |
80 Above | 4% |
Males by Age Distribution
Status | Percentage |
---|---|
0-9 | 11% |
10-19 | 13% |
20-29 | 13% |
30-39 | 12% |
40-49 | 11% |
50-59 | 13% |
60-69 | 11% |
70-79 | 14% |
80 Above | 3% |
Females by Age Distribution
Status | Percentage |
---|---|
0-9 | 10% |
10-19 | 11% |
20-29 | 12% |
30-39 | 11% |
40-49 | 11% |
50-59 | 14% |
60-69 | 12% |
70-79 | 13% |
80 Above | 4% |