Loyalhanna Continuing Care Center
$ Call for Rates
535 McFarland Rd, Latrobe, PA 15650
Overview
Care Types: Nursing Care, Continuing Care, Independent Living, Respite Care-Short Term Stay
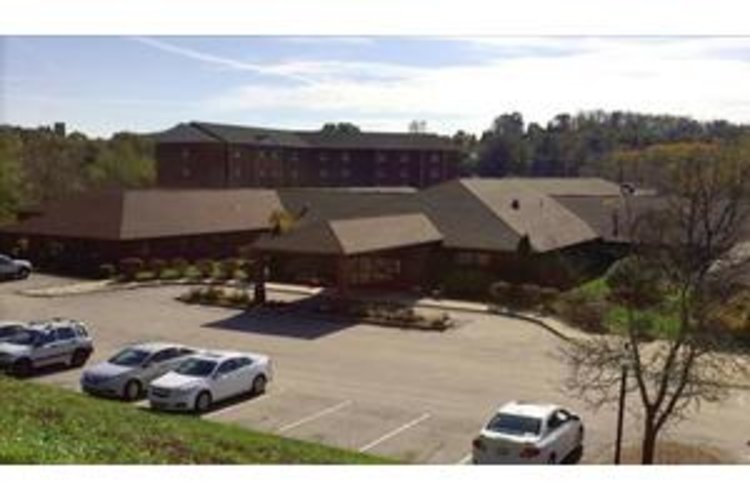
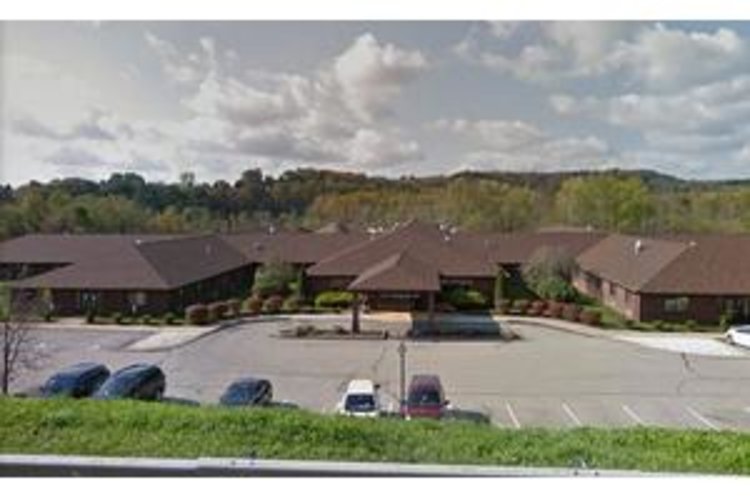
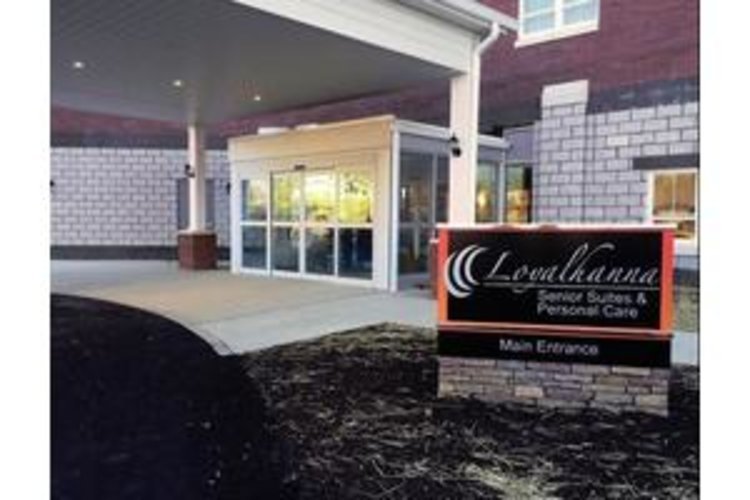
Loyalhanna Continuing Care Campus is located in Latrobe, PA, in a quiet area a few minutes away from the suburbs. Nearby essentials include stores, restaurants, parks, churches, banks and credit unions. Seniors can visitLatrobe Cardiology Associates, Excela Health Latrobe Hospitaland Excela Health Pulmonology for medical treatment.
Contact for available floor plans
Contact for available Payment Options
DEMOGRAPHIC BREAKDOWN
34%
Single
Marital Status
46%
Married Couples
Community
77%
Drove By Themselves
Commute
4%
Below 9th Grade
Highest Level of Education
25%
Children
Adult vs. Children
11%
0-9
Population by Age
11%
0-9
Males by Age Distribution
10%
0-9
Females by Age Distribution
Males by Age Distribution
Status | Percentage |
---|---|
0-9 | 11% |
10-19 | 12% |
20-29 | 13% |
30-39 | 11% |
40-49 | 12% |
50-59 | 14% |
60-69 | 11% |
70-79 | 13% |
80 Above | 3% |
Females by Age Distribution
Status | Percentage |
---|---|
0-9 | 10% |
10-19 | 11% |
20-29 | 12% |
30-39 | 11% |
40-49 | 12% |
50-59 | 14% |
60-69 | 12% |
70-79 | 13% |
80 Above | 6% |
Marital Status
Status | Percentage |
---|---|
Single | 34% |
Married (Not Separated) | 48% |
Separated | 2% |
Widowed | 7% |
Divorced | 10% |
Community
Status | Percentage |
---|---|
Married Couples | 46% |
Single Females | 11% |
Single Males | 4% |
Living Alone | 11% |
Living With Family | 27% |
Commute
Status | Percentage |
---|---|
Drove By Themselves | 77% |
Public Transportation | 5% |
Carpooled | 9% |
Walked | 4% |
Occasional Drive | 0% |
Work At Home | 4% |
Other | 1% |
Highest Level of Education
Status | Percentage |
---|---|
Below 9th Grade | 4% |
Bachelors Degree | 17% |
High School | 37% |
College | 16% |
Associate Degree | 8% |
9th to 12th Grade | 7% |
Graduate | 11% |
Adult vs. Children
Status | Percentage |
---|---|
Children | 25% |
Adult | 75% |
Population by Age
Status | Percentage |
---|---|
0-9 | 11% |
10-19 | 13% |
20-29 | 13% |
30-39 | 12% |
40-49 | 13% |
50-59 | 15% |
60-69 | 12% |
70-79 | 7% |
80 Above | 5% |
Males by Age Distribution
Status | Percentage |
---|---|
0-9 | 11% |
10-19 | 12% |
20-29 | 13% |
30-39 | 11% |
40-49 | 12% |
50-59 | 14% |
60-69 | 11% |
70-79 | 13% |
80 Above | 3% |
Females by Age Distribution
Status | Percentage |
---|---|
0-9 | 10% |
10-19 | 11% |
20-29 | 12% |
30-39 | 11% |
40-49 | 12% |
50-59 | 14% |
60-69 | 12% |
70-79 | 13% |
80 Above | 6% |