

Hillside Manor
$ Call for Rates
18215 Hillside Avenue, Queens, NY 11432
Overview
Care Types: Nursing Care
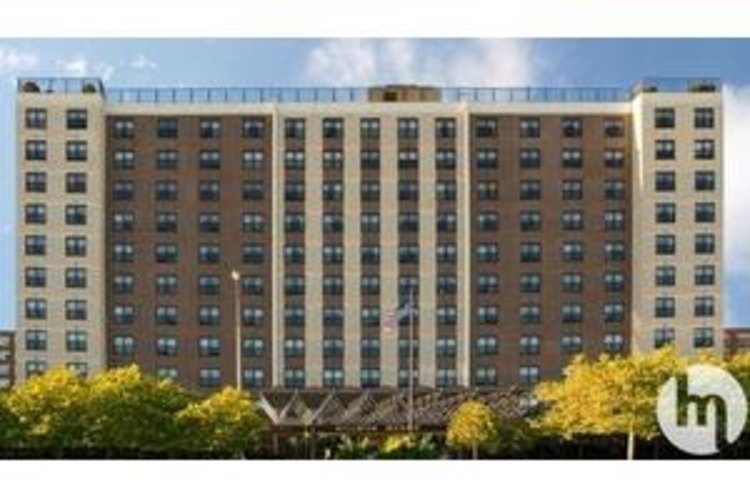
Hillside Manor
Hillside Manor is a rehabilitation and long-term care facility located in Queens, New York City. Residents have access to some of the most highly ranked hospitals nationwide, including several that have high performing geriatrics care, such as Mount Sinai and NYU Langone Hospital. Proximity to Manhattan also gives seniors more choices for pharmacies, doctors and therapists.
For seniors needing rehabilitation from a hospital visit or surgery, Hillside Manor provides medical care 24/7 with access to a registered nurse. Occupational and physical therapy help speed the recovery process. Those in long-term care can receive a personalized care plan, blood sugar monitoring, medication management and assistance getting in and out of bed to attend activities and meals. …. SHOW MORE
Seniors can participate in a variety of classes and programs meant to provide a sense of meaning and purpose, from wellness classes to arts and crafts and games. Hot meals are provided three times daily, and residents can also enjoy a snack in one of the common areas.
SHOW LESSContact for available floor plans
Contact for available Payment Options
Neighborhood & Demographics

DEMOGRAPHIC BREAKDOWN
39%
Single
Marital Status
43%
Married Couples
Community
54%
Drove By Themselves
Commute
7%
Below 9th Grade
Highest Level of Education
25%
Children
Adult vs. Children
12%
0-9
Population by Age
12%
0-9
Males by Age Distribution
11%
0-9
Females by Age Distribution
Males by Age Distribution
| Status | Percentage |
|---|---|
| 0-9 | 12% |
| 10-19 | 12% |
| 20-29 | 14% |
| 30-39 | 13% |
| 40-49 | 12% |
| 50-59 | 13% |
| 60-69 | 10% |
| 70-79 | 12% |
| 80 Above | 3% |
Females by Age Distribution
| Status | Percentage |
|---|---|
| 0-9 | 11% |
| 10-19 | 11% |
| 20-29 | 14% |
| 30-39 | 13% |
| 40-49 | 12% |
| 50-59 | 13% |
| 60-69 | 11% |
| 70-79 | 11% |
| 80 Above | 5% |
Marital Status
| Status | Percentage |
|---|---|
| Single | 39% |
| Married (Not Separated) | 44% |
| Separated | 3% |
| Widowed | 6% |
| Divorced | 9% |
Community
| Status | Percentage |
|---|---|
| Married Couples | 43% |
| Single Females | 15% |
| Single Males | 5% |
| Living Alone | 11% |
| Living With Family | 27% |
Commute
| Status | Percentage |
|---|---|
| Drove By Themselves | 54% |
| Public Transportation | 27% |
| Carpooled | 7% |
| Walked | 6% |
| Occasional Drive | 0% |
| Work At Home | 4% |
| Other | 2% |
Highest Level of Education
| Status | Percentage |
|---|---|
| Below 9th Grade | 7% |
| Bachelors Degree | 19% |
| High School | 27% |
| College | 16% |
| Associate Degree | 8% |
| 9th to 12th Grade | 8% |
| Graduate | 15% |
Adult vs. Children
| Status | Percentage |
|---|---|
| Children | 25% |
| Adult | 75% |
Population by Age
| Status | Percentage |
|---|---|
| 0-9 | 12% |
| 10-19 | 13% |
| 20-29 | 14% |
| 30-39 | 13% |
| 40-49 | 13% |
| 50-59 | 14% |
| 60-69 | 11% |
| 70-79 | 6% |
| 80 Above | 4% |
Males by Age Distribution
| Status | Percentage |
|---|---|
| 0-9 | 12% |
| 10-19 | 12% |
| 20-29 | 14% |
| 30-39 | 13% |
| 40-49 | 12% |
| 50-59 | 13% |
| 60-69 | 10% |
| 70-79 | 12% |
| 80 Above | 3% |
Females by Age Distribution
| Status | Percentage |
|---|---|
| 0-9 | 11% |
| 10-19 | 11% |
| 20-29 | 14% |
| 30-39 | 13% |
| 40-49 | 12% |
| 50-59 | 13% |
| 60-69 | 11% |
| 70-79 | 11% |
| 80 Above | 5% |
