Hillsdale Rehabilitation & Nursing Center
$ Call for Rates
383 Mountain View Dr, Hillsdale, PA 15746
Overview
Care Types: Nursing Care
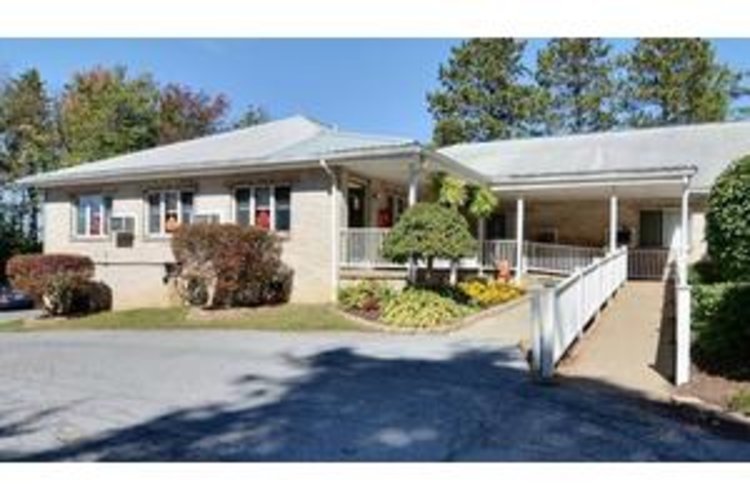
Welcome to Hillsdale Rehab & Nursing Center! The skills of uniquely qualified physicians and nurses, therapists and other team members is just what is needed to get you from our home to your home- even better.
It happens. An injury or acute illness finds you or a family member in the hospital. And while everything turns out fine, sometimes, before you or your family member can return home, there is a need for support, retraining and rehabilitation to help regain strength, mobility, communication skills and overall independence for life's daily activities.
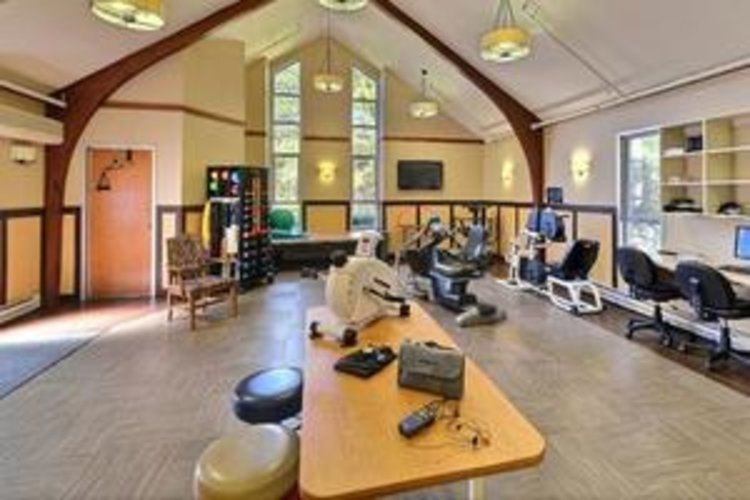
Rapid Recovery at Hillsdale Rehabilitation & Nursing Center is a Clinical Excellence Program designed by a team of professionals to get your loved one home quicker, stronger, and healthier than ever. All while improving the quality of care they will receive as well as reduce readmissions to the hospital.
Contact for available floor plans
Contact for available Payment Options
Neighborhood & Demographics
DEMOGRAPHIC BREAKDOWN
34%
Single
Marital Status
46%
Married Couples
Community
77%
Drove By Themselves
Commute
4%
Below 9th Grade
Highest Level of Education
25%
Children
Adult vs. Children
11%
0-9
Population by Age
11%
0-9
Males by Age Distribution
10%
0-9
Females by Age Distribution
Males by Age Distribution
Status | Percentage |
---|---|
0-9 | 11% |
10-19 | 12% |
20-29 | 13% |
30-39 | 11% |
40-49 | 12% |
50-59 | 14% |
60-69 | 11% |
70-79 | 13% |
80 Above | 3% |
Females by Age Distribution
Status | Percentage |
---|---|
0-9 | 10% |
10-19 | 11% |
20-29 | 12% |
30-39 | 11% |
40-49 | 12% |
50-59 | 14% |
60-69 | 12% |
70-79 | 13% |
80 Above | 6% |
Marital Status
Status | Percentage |
---|---|
Single | 34% |
Married (Not Separated) | 48% |
Separated | 2% |
Widowed | 7% |
Divorced | 10% |
Community
Status | Percentage |
---|---|
Married Couples | 46% |
Single Females | 11% |
Single Males | 4% |
Living Alone | 11% |
Living With Family | 27% |
Commute
Status | Percentage |
---|---|
Drove By Themselves | 77% |
Public Transportation | 5% |
Carpooled | 9% |
Walked | 4% |
Occasional Drive | 0% |
Work At Home | 4% |
Other | 1% |
Highest Level of Education
Status | Percentage |
---|---|
Below 9th Grade | 4% |
Bachelors Degree | 17% |
High School | 37% |
College | 16% |
Associate Degree | 8% |
9th to 12th Grade | 7% |
Graduate | 11% |
Adult vs. Children
Status | Percentage |
---|---|
Children | 25% |
Adult | 75% |
Population by Age
Status | Percentage |
---|---|
0-9 | 11% |
10-19 | 13% |
20-29 | 13% |
30-39 | 12% |
40-49 | 13% |
50-59 | 15% |
60-69 | 12% |
70-79 | 7% |
80 Above | 5% |
Males by Age Distribution
Status | Percentage |
---|---|
0-9 | 11% |
10-19 | 12% |
20-29 | 13% |
30-39 | 11% |
40-49 | 12% |
50-59 | 14% |
60-69 | 11% |
70-79 | 13% |
80 Above | 3% |
Females by Age Distribution
Status | Percentage |
---|---|
0-9 | 10% |
10-19 | 11% |
20-29 | 12% |
30-39 | 11% |
40-49 | 12% |
50-59 | 14% |
60-69 | 12% |
70-79 | 13% |
80 Above | 6% |