40.4874
-88.9838
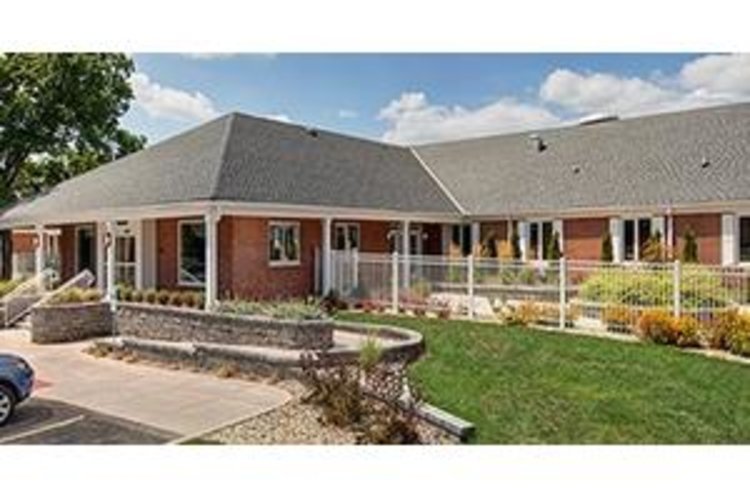
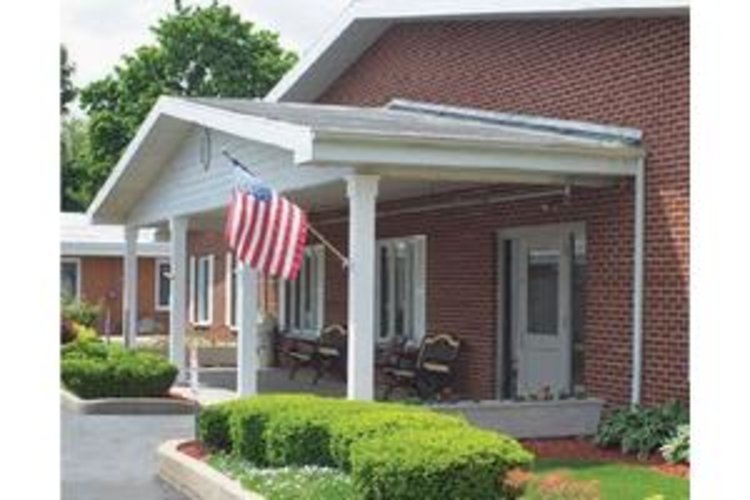
Heritage Health – bloomington
$ Call for Rates
700 E Walnut, Bloomington, IL 61701
$ Call for Rates
700 E Walnut, Bloomington, IL 61701
Care Types: Nursing Care
Heritage Health Therapy and Senior Care ��� Bloomington is located in Bloomington, Illinois, which offers excellent shopping, dining and recreational spaces in one of Illinois’ most sought-after communities. Excellent health care options are available, including St. Joseph’s Medical Center.
Heritage Health Therapy and Senior Care ��� Bloomington offers short-term and long-term residential services for seniors. Physical therapy, occupational therapy and speech therapy programs are available for long-term residents and those planning on returning home after treatment. Skilled nursing care, hospice care and wound care are offered to residents in a safe and caring environment. …. SHOW MORE
Residents have access to dining, social and entertainment options during their stay. On-staff social workers administer a social service program, and transportation is available for outings and medical appointments. An on-site beauty salon/barbershop and indoor common areas such as the Winter Garden Room are available for resident use.
SHOW LESS
35%
Single
Marital Status
48%
Married Couples
Community
73%
Drove By Themselves
Commute
6%
Below 9th Grade
Highest Level of Education
27%
Children
Adult vs. Children
12%
0-9
Population by Age
12%
0-9
Males by Age Distribution
11%
0-9
Females by Age Distribution
| Status | Percentage |
|---|---|
| 0-9 | 12% |
| 10-19 | 13% |
| 20-29 | 13% |
| 30-39 | 13% |
| 40-49 | 12% |
| 50-59 | 13% |
| 60-69 | 10% |
| 70-79 | 11% |
| 80 Above | 3% |
| Status | Percentage |
|---|---|
| 0-9 | 11% |
| 10-19 | 12% |
| 20-29 | 13% |
| 30-39 | 13% |
| 40-49 | 12% |
| 50-59 | 13% |
| 60-69 | 10% |
| 70-79 | 11% |
| 80 Above | 4% |
| Status | Percentage |
|---|---|
| Single | 35% |
| Married (Not Separated) | 47% |
| Separated | 2% |
| Widowed | 6% |
| Divorced | 10% |
| Status | Percentage |
|---|---|
| Married Couples | 48% |
| Single Females | 13% |
| Single Males | 5% |
| Living Alone | 10% |
| Living With Family | 25% |
| Status | Percentage |
|---|---|
| Drove By Themselves | 73% |
| Public Transportation | 9% |
| Carpooled | 9% |
| Walked | 3% |
| Occasional Drive | 0% |
| Work At Home | 4% |
| Other | 2% |
| Status | Percentage |
|---|---|
| Below 9th Grade | 6% |
| Bachelors Degree | 20% |
| High School | 27% |
| College | 21% |
| Associate Degree | 8% |
| 9th to 12th Grade | 7% |
| Graduate | 12% |
| Status | Percentage |
|---|---|
| Children | 27% |
| Adult | 73% |
| Status | Percentage |
|---|---|
| 0-9 | 12% |
| 10-19 | 14% |
| 20-29 | 13% |
| 30-39 | 14% |
| 40-49 | 13% |
| 50-59 | 14% |
| 60-69 | 11% |
| 70-79 | 6% |
| 80 Above | 4% |
| Status | Percentage |
|---|---|
| 0-9 | 12% |
| 10-19 | 13% |
| 20-29 | 13% |
| 30-39 | 13% |
| 40-49 | 12% |
| 50-59 | 13% |
| 60-69 | 10% |
| 70-79 | 11% |
| 80 Above | 3% |
| Status | Percentage |
|---|---|
| 0-9 | 11% |
| 10-19 | 12% |
| 20-29 | 13% |
| 30-39 | 13% |
| 40-49 | 12% |
| 50-59 | 13% |
| 60-69 | 10% |
| 70-79 | 11% |
| 80 Above | 4% |
By clicking “Request Info” you agree to our Terms of Use and Privacy Policy. You also consent to receive texts and calls, which may be autodialed, from us and our partner providers; however, your consent is not a condition to using our service.

By clicking “Request Info”, you agree to our Terms of Use, our Privacy Policy, and our Agreement to be Contacted by Telephone. You also consent that we, or our partner providers, may reach out to you about senior living solutions or Medicare insurance using a system that can auto-dial; however, you do not need to consent to this to use our service.