
Heartland of Madeira
$ Call for Rates
5970 Kenwood Road, Madeira, OH 45243
Overview
Care Types: Nursing Care, Memory Care, Assisted Living
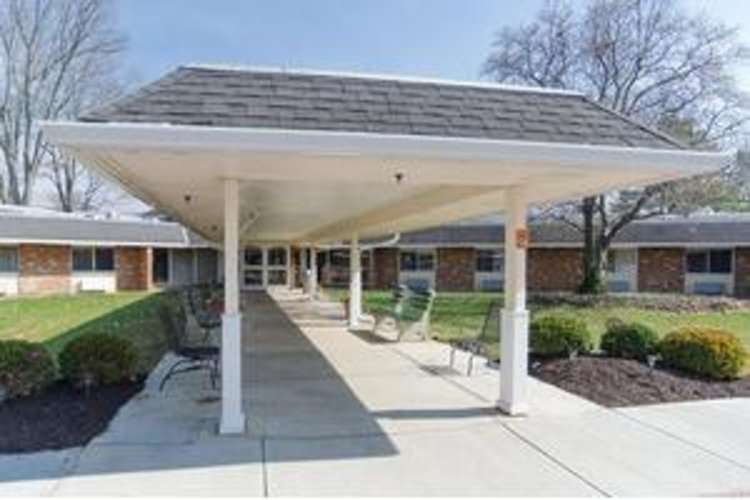
Heartland of Madeira
Offering nursing care as well as shorter rehabilitative stays, Heartland of Madeira is located in the Cincinnati suburb of Madeira. Seniors have a number of highly-ranked hospitals minutes away, including Christ Hospital (also high performing for geriatrics care), Good Samaritan Hospital and Bethesda North Hospital. Being in close proximity to Cincinnati also means seniors have a greater number of pharmacies and doctors from which to choose.
Licensed care professionals, together with skilled nurses and therapists, help seniors recovering from a heart attack, stroke or surgery by providing individualized services. Medical care is available 24/7 when necessary, and Heartland of Madeira also provides social services, medication management and blood sugar monitoring. …. SHOW MORE
Seniors at Heartland of Madeira receive homemade meals served daily as well as housekeeping and linen services. Common areas offer places to relax or socialize, and an ongoing calendar of activities lets residents stay healthy, active and involved.
SHOW LESSContact for available floor plans
Contact for available Payment Options
Neighborhood & Demographics

DEMOGRAPHIC BREAKDOWN
32%
Single
Marital Status
46%
Married Couples
Community
84%
Drove By Themselves
Commute
3%
Below 9th Grade
Highest Level of Education
27%
Children
Adult vs. Children
12%
0-9
Population by Age
12%
0-9
Males by Age Distribution
11%
0-9
Females by Age Distribution
Males by Age Distribution
| Status | Percentage |
|---|---|
| 0-9 | 12% |
| 10-19 | 13% |
| 20-29 | 13% |
| 30-39 | 12% |
| 40-49 | 12% |
| 50-59 | 13% |
| 60-69 | 11% |
| 70-79 | 12% |
| 80 Above | 3% |
Females by Age Distribution
| Status | Percentage |
|---|---|
| 0-9 | 11% |
| 10-19 | 12% |
| 20-29 | 12% |
| 30-39 | 11% |
| 40-49 | 12% |
| 50-59 | 14% |
| 60-69 | 11% |
| 70-79 | 12% |
| 80 Above | 5% |
Marital Status
| Status | Percentage |
|---|---|
| Single | 32% |
| Married (Not Separated) | 48% |
| Separated | 2% |
| Widowed | 6% |
| Divorced | 12% |
Community
| Status | Percentage |
|---|---|
| Married Couples | 46% |
| Single Females | 13% |
| Single Males | 4% |
| Living Alone | 11% |
| Living With Family | 26% |
Commute
| Status | Percentage |
|---|---|
| Drove By Themselves | 84% |
| Public Transportation | 2% |
| Carpooled | 8% |
| Walked | 2% |
| Occasional Drive | 0% |
| Work At Home | 4% |
| Other | 1% |
Highest Level of Education
| Status | Percentage |
|---|---|
| Below 9th Grade | 3% |
| Bachelors Degree | 16% |
| High School | 34% |
| College | 21% |
| Associate Degree | 8% |
| 9th to 12th Grade | 8% |
| Graduate | 10% |
Adult vs. Children
| Status | Percentage |
|---|---|
| Children | 27% |
| Adult | 73% |
Population by Age
| Status | Percentage |
|---|---|
| 0-9 | 12% |
| 10-19 | 14% |
| 20-29 | 13% |
| 30-39 | 12% |
| 40-49 | 13% |
| 50-59 | 14% |
| 60-69 | 12% |
| 70-79 | 6% |
| 80 Above | 4% |
Males by Age Distribution
| Status | Percentage |
|---|---|
| 0-9 | 12% |
| 10-19 | 13% |
| 20-29 | 13% |
| 30-39 | 12% |
| 40-49 | 12% |
| 50-59 | 13% |
| 60-69 | 11% |
| 70-79 | 12% |
| 80 Above | 3% |
Females by Age Distribution
| Status | Percentage |
|---|---|
| 0-9 | 11% |
| 10-19 | 12% |
| 20-29 | 12% |
| 30-39 | 11% |
| 40-49 | 12% |
| 50-59 | 14% |
| 60-69 | 11% |
| 70-79 | 12% |
| 80 Above | 5% |
