37.3738
-122.078
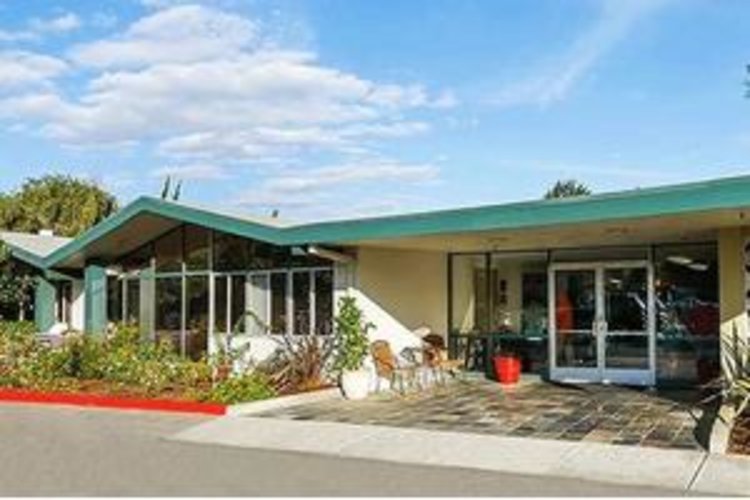
Grant Cuesta Sub-acute and Rehabilitation Center
$ Call for Rates
1949 GRANT ROAD, Mountain View, CA 94040
$ Call for Rates
1949 GRANT ROAD, Mountain View, CA 94040
Care Types: Nursing Care, Alzheimer’s Care
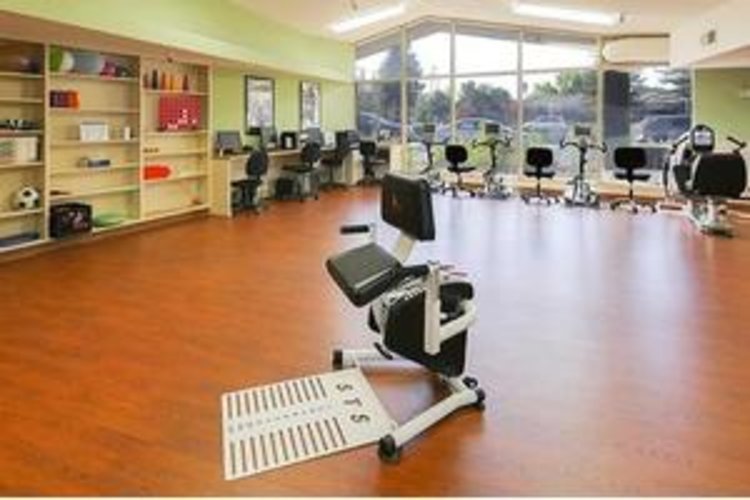
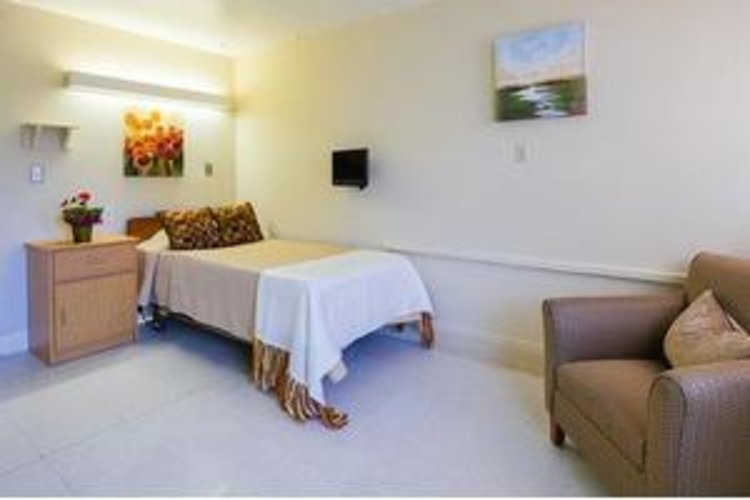
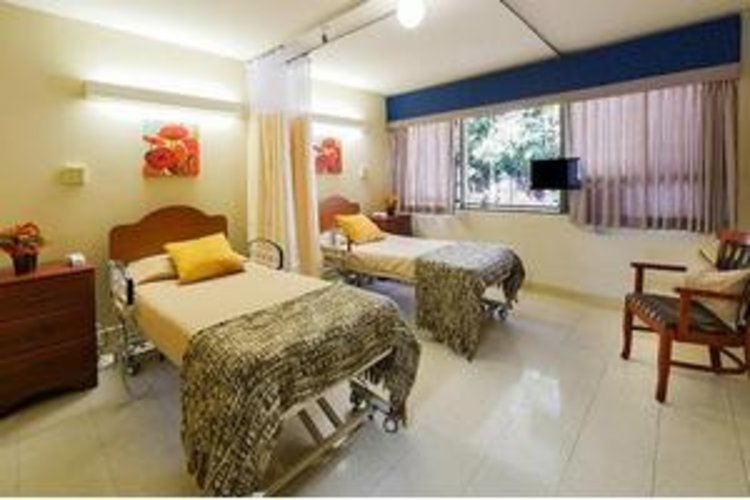
Touching Lives Is At The Heart Of Caring. Best Nursing Homes Mountain View, CAGrant Cuesta Sub-Acute and Rehabilitation Center, located in Mountain View near San Jose, CA. in the Bay Area, offers 24-hour skilled nursing and rehabilitation therapy services with experienced staff dedicated to treating our residents with dignity and respect. Our nursing and rehab care assist individuals in regaining their highest level of independence, improve their current abilities, and making their stay as comfortable as possible. Our nursing home offers everything from physical therapy, occupational therapy, post-acute care to Alzheimer’s care. We provide residents with a customized program and attend to their specific needs. As part of the Covenant Care family, we’ve made it our goal to transform typical health services into HEALTHCARE WITH HEART!

37%
Single
Marital Status
48%
Married Couples
Community
73%
Drove By Themselves
Commute
10%
Below 9th Grade
Highest Level of Education
28%
Children
Adult vs. Children
13%
0-9
Population by Age
13%
0-9
Males by Age Distribution
12%
0-9
Females by Age Distribution
| Status | Percentage |
|---|---|
| 0-9 | 13% |
| 10-19 | 13% |
| 20-29 | 15% |
| 30-39 | 13% |
| 40-49 | 13% |
| 50-59 | 12% |
| 60-69 | 9% |
| 70-79 | 10% |
| 80 Above | 3% |
| Status | Percentage |
|---|---|
| 0-9 | 12% |
| 10-19 | 12% |
| 20-29 | 14% |
| 30-39 | 13% |
| 40-49 | 13% |
| 50-59 | 13% |
| 60-69 | 10% |
| 70-79 | 10% |
| 80 Above | 4% |
| Status | Percentage |
|---|---|
| Single | 37% |
| Married (Not Separated) | 46% |
| Separated | 2% |
| Widowed | 5% |
| Divorced | 10% |
| Status | Percentage |
|---|---|
| Married Couples | 48% |
| Single Females | 13% |
| Single Males | 6% |
| Living Alone | 8% |
| Living With Family | 25% |
| Status | Percentage |
|---|---|
| Drove By Themselves | 73% |
| Public Transportation | 5% |
| Carpooled | 11% |
| Walked | 3% |
| Occasional Drive | 0% |
| Work At Home | 5% |
| Other | 2% |
| Status | Percentage |
|---|---|
| Below 9th Grade | 10% |
| Bachelors Degree | 20% |
| High School | 21% |
| College | 22% |
| Associate Degree | 8% |
| 9th to 12th Grade | 8% |
| Graduate | 11% |
| Status | Percentage |
|---|---|
| Children | 28% |
| Adult | 72% |
| Status | Percentage |
|---|---|
| 0-9 | 13% |
| 10-19 | 14% |
| 20-29 | 14% |
| 30-39 | 14% |
| 40-49 | 13% |
| 50-59 | 13% |
| 60-69 | 10% |
| 70-79 | 5% |
| 80 Above | 3% |
| Status | Percentage |
|---|---|
| 0-9 | 13% |
| 10-19 | 13% |
| 20-29 | 15% |
| 30-39 | 13% |
| 40-49 | 13% |
| 50-59 | 12% |
| 60-69 | 9% |
| 70-79 | 10% |
| 80 Above | 3% |
| Status | Percentage |
|---|---|
| 0-9 | 12% |
| 10-19 | 12% |
| 20-29 | 14% |
| 30-39 | 13% |
| 40-49 | 13% |
| 50-59 | 13% |
| 60-69 | 10% |
| 70-79 | 10% |
| 80 Above | 4% |
By clicking “Request Info” you agree to our Terms of Use and Privacy Policy. You also consent to receive texts and calls, which may be autodialed, from us and our partner providers; however, your consent is not a condition to using our service.

By clicking “Request Info”, you agree to our Terms of Use, our Privacy Policy, and our Agreement to be Contacted by Telephone. You also consent that we, or our partner providers, may reach out to you about senior living solutions or Medicare insurance using a system that can auto-dial; however, you do not need to consent to this to use our service.