Ginger Cove
$ Call for Rates
4000 River Crescent Drive, Annapolis, MD 21401
Overview
Care Types: Retirement, Nursing Care
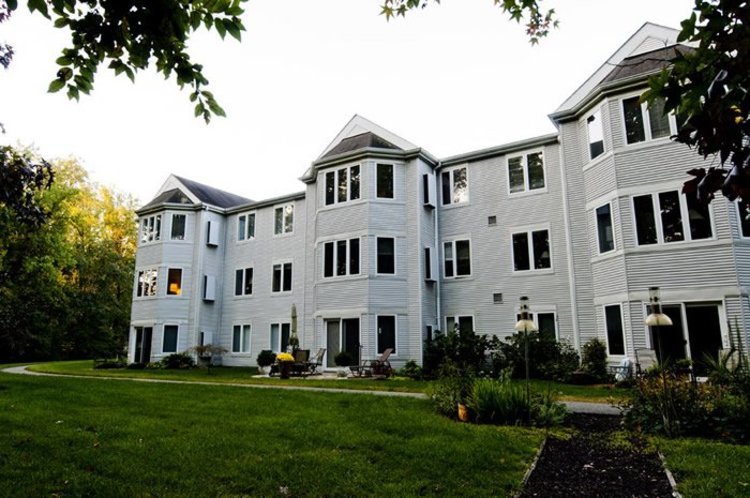
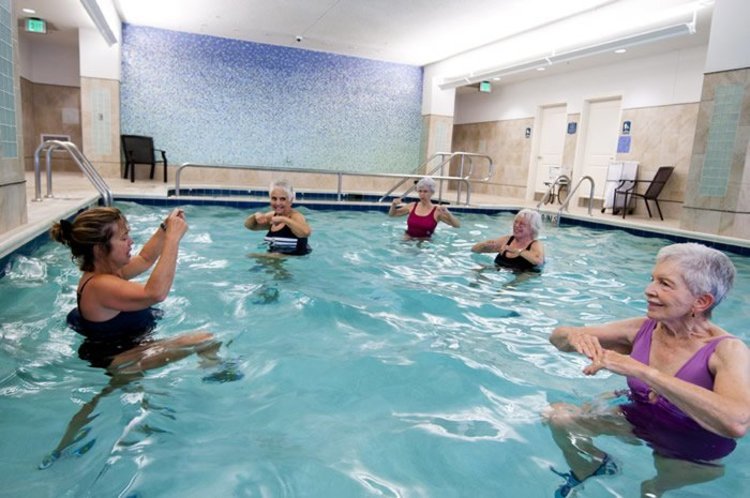
Ginger Cove has continually expanded in phases over the years. The second phase, completed in 1990, included the 1000 and 8000 buildings, Friendship Hall (our auditorium) and the pool. A Health Services expansion was completed in 1993, adding additional skilled nursing beds and the Clinic. In 2003, the assisted living building was constructed, offering 30 private deluxe suites. Just five years later, in 2008, to celebrate our 20th anniversary, we launched an extensive expansion and renovation of our health and wellness facilities. Completed in 2010, residents now enjoy even more amenities and
Contact for available floor plans
Contact for available Payment Options
DEMOGRAPHIC BREAKDOWN
35%
Single
Marital Status
47%
Married Couples
Community
74%
Drove By Themselves
Commute
4%
Below 9th Grade
Highest Level of Education
26%
Children
Adult vs. Children
12%
0-9
Population by Age
12%
0-9
Males by Age Distribution
11%
0-9
Females by Age Distribution
Males by Age Distribution
Status | Percentage |
---|---|
0-9 | 12% |
10-19 | 12% |
20-29 | 13% |
30-39 | 13% |
40-49 | 12% |
50-59 | 14% |
60-69 | 10% |
70-79 | 11% |
80 Above | 2% |
Females by Age Distribution
Status | Percentage |
---|---|
0-9 | 11% |
10-19 | 12% |
20-29 | 13% |
30-39 | 13% |
40-49 | 13% |
50-59 | 14% |
60-69 | 11% |
70-79 | 11% |
80 Above | 4% |
Marital Status
Status | Percentage |
---|---|
Single | 35% |
Married (Not Separated) | 47% |
Separated | 2% |
Widowed | 6% |
Divorced | 10% |
Community
Status | Percentage |
---|---|
Married Couples | 47% |
Single Females | 14% |
Single Males | 5% |
Living Alone | 9% |
Living With Family | 25% |
Commute
Status | Percentage |
---|---|
Drove By Themselves | 74% |
Public Transportation | 9% |
Carpooled | 10% |
Walked | 2% |
Occasional Drive | 0% |
Work At Home | 4% |
Other | 1% |
Highest Level of Education
Status | Percentage |
---|---|
Below 9th Grade | 4% |
Bachelors Degree | 20% |
High School | 26% |
College | 20% |
Associate Degree | 6% |
9th to 12th Grade | 7% |
Graduate | 17% |
Adult vs. Children
Status | Percentage |
---|---|
Children | 26% |
Adult | 74% |
Population by Age
Status | Percentage |
---|---|
0-9 | 12% |
10-19 | 13% |
20-29 | 13% |
30-39 | 13% |
40-49 | 13% |
50-59 | 15% |
60-69 | 11% |
70-79 | 6% |
80 Above | 3% |
Males by Age Distribution
Status | Percentage |
---|---|
0-9 | 12% |
10-19 | 12% |
20-29 | 13% |
30-39 | 13% |
40-49 | 12% |
50-59 | 14% |
60-69 | 10% |
70-79 | 11% |
80 Above | 2% |
Females by Age Distribution
Status | Percentage |
---|---|
0-9 | 11% |
10-19 | 12% |
20-29 | 13% |
30-39 | 13% |
40-49 | 13% |
50-59 | 14% |
60-69 | 11% |
70-79 | 11% |
80 Above | 4% |