Fort Tryon Center for Rehabilitation and Nursing
$ Call for Rates
801 W 190th St, New York, NY 10040
Overview
Care Types: Home Care
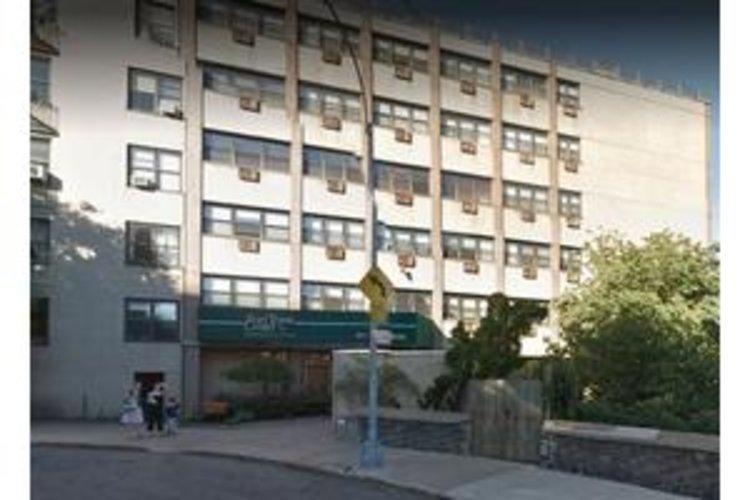
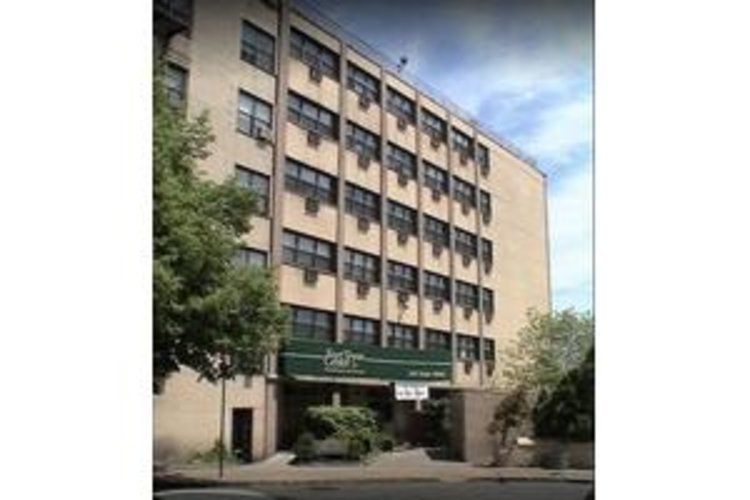
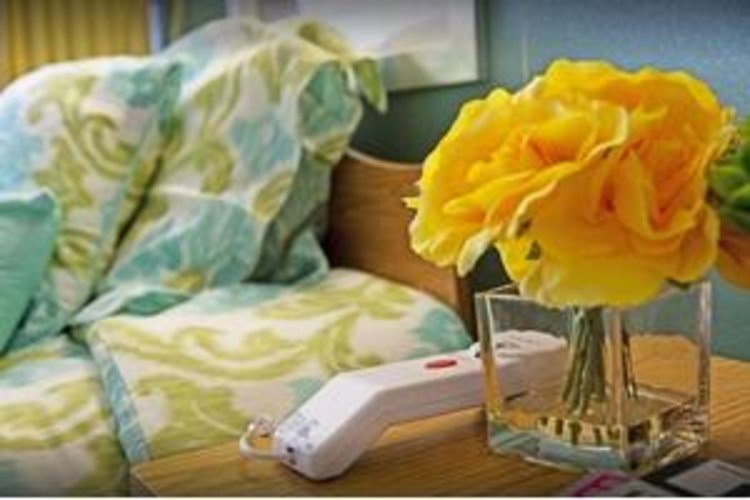
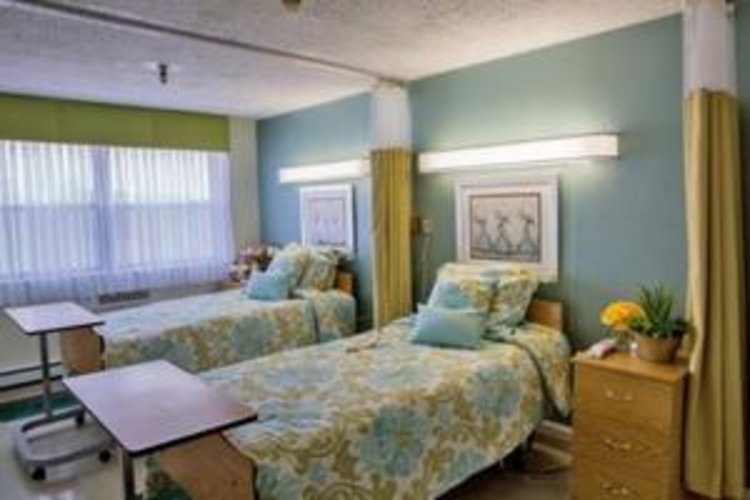
Welcome to Fort Tryon Center! Located in the Cloisters section of Upper Manhattan, Fort Tryon Center for Rehabilitation and Nursing is a modern, state of the art nursing center. We offer spacious accommodations, with comfortable rooms that are tastefully decorated and appointed.
At Fort Tryon Center for rehabilitation and nursing, we are dedicated to providing quality care for those in need of short term rehabilitation or long term skilled nursing.
Our staff physicians and clinical teams are focused on one goal- to help patients recover and gain maximum functionality in a most caring and loving environment.
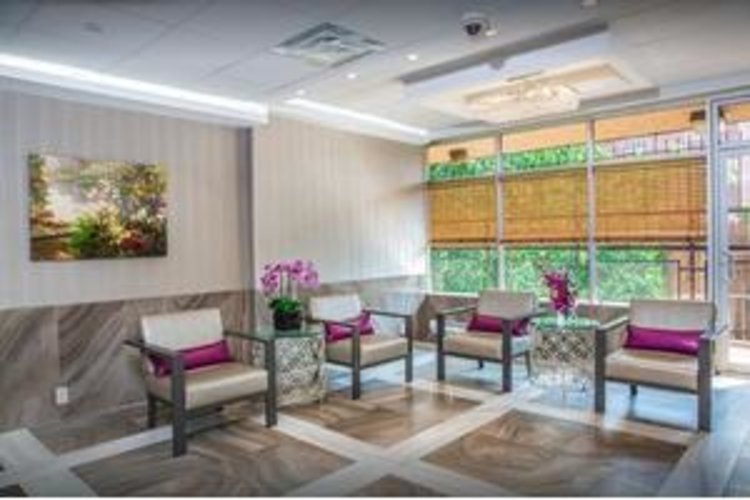
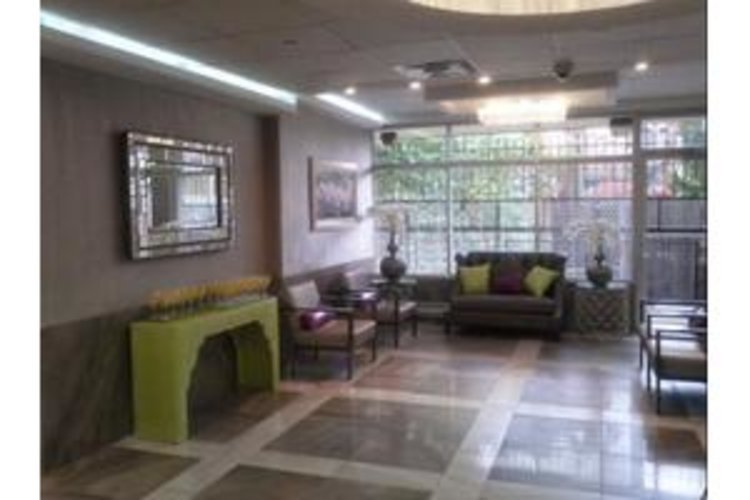
Be pampered in luxury as you recover. Fort Tryon Center has recently undergone extensive renovations and now boasts a state of the art décor and amenities, giving it an upscale, luxurious ambiance.
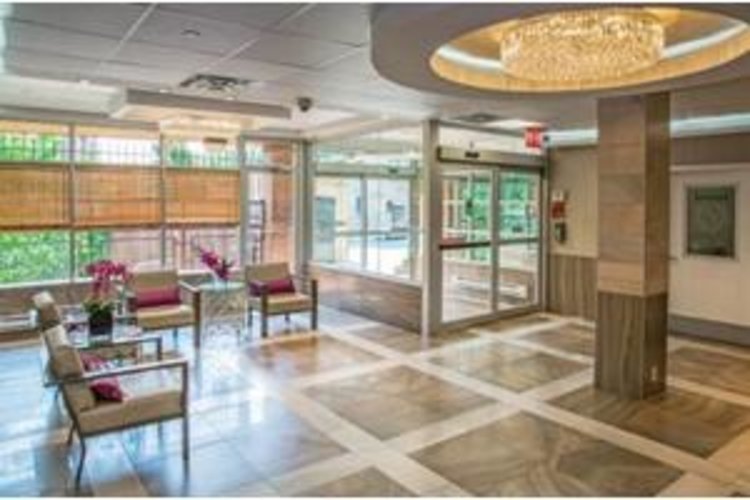
The moment you enter, you will be welcomed in our gleaming marble lobby by a staff that is eager to please and anxious to help you in your recovery.
While at Fort Tryon Center, be sure to make use of our state of the art, beautiful granite and stainless steel kitchenette, sit out on our expansive terrace with awesome city views and feel like you are outdoors while rehabilitating in our floor to ceiling windowed gym.
Contact for available floor plans
Contact for available Payment Options
DEMOGRAPHIC BREAKDOWN
39%
Single
Marital Status
43%
Married Couples
Community
54%
Drove By Themselves
Commute
7%
Below 9th Grade
Highest Level of Education
25%
Children
Adult vs. Children
12%
0-9
Population by Age
12%
0-9
Males by Age Distribution
11%
0-9
Females by Age Distribution
Males by Age Distribution
Status | Percentage |
---|---|
0-9 | 12% |
10-19 | 12% |
20-29 | 14% |
30-39 | 13% |
40-49 | 12% |
50-59 | 13% |
60-69 | 10% |
70-79 | 12% |
80 Above | 3% |
Females by Age Distribution
Status | Percentage |
---|---|
0-9 | 11% |
10-19 | 11% |
20-29 | 14% |
30-39 | 13% |
40-49 | 12% |
50-59 | 13% |
60-69 | 11% |
70-79 | 11% |
80 Above | 5% |
Marital Status
Status | Percentage |
---|---|
Single | 39% |
Married (Not Separated) | 44% |
Separated | 3% |
Widowed | 6% |
Divorced | 9% |
Community
Status | Percentage |
---|---|
Married Couples | 43% |
Single Females | 15% |
Single Males | 5% |
Living Alone | 11% |
Living With Family | 27% |
Commute
Status | Percentage |
---|---|
Drove By Themselves | 54% |
Public Transportation | 27% |
Carpooled | 7% |
Walked | 6% |
Occasional Drive | 0% |
Work At Home | 4% |
Other | 2% |
Highest Level of Education
Status | Percentage |
---|---|
Below 9th Grade | 7% |
Bachelors Degree | 19% |
High School | 27% |
College | 16% |
Associate Degree | 8% |
9th to 12th Grade | 8% |
Graduate | 15% |
Adult vs. Children
Status | Percentage |
---|---|
Children | 25% |
Adult | 75% |
Population by Age
Status | Percentage |
---|---|
0-9 | 12% |
10-19 | 13% |
20-29 | 14% |
30-39 | 13% |
40-49 | 13% |
50-59 | 14% |
60-69 | 11% |
70-79 | 6% |
80 Above | 4% |
Males by Age Distribution
Status | Percentage |
---|---|
0-9 | 12% |
10-19 | 12% |
20-29 | 14% |
30-39 | 13% |
40-49 | 12% |
50-59 | 13% |
60-69 | 10% |
70-79 | 12% |
80 Above | 3% |
Females by Age Distribution
Status | Percentage |
---|---|
0-9 | 11% |
10-19 | 11% |
20-29 | 14% |
30-39 | 13% |
40-49 | 12% |
50-59 | 13% |
60-69 | 11% |
70-79 | 11% |
80 Above | 5% |