38.8478
-76.8782
Driving Directions
Street View
Photos
Map
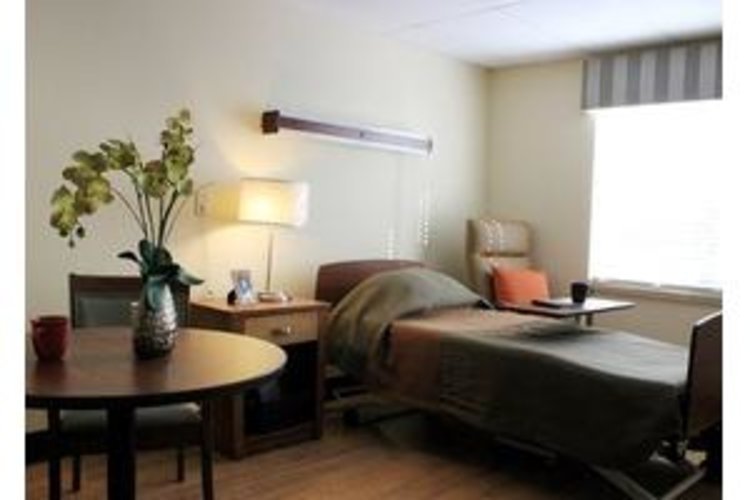
Forestville Health and Rehabilitation Center
$ Call for Rates
7420 Marlboro Pike, Forestville, MD 20747
Overview
Care Types: Nursing Care
Welcome to Forestville Health Center a skilled nursing center, offering short-term recovery and rehabilitation services and long-term care and programming, focused on your emotional and physical well-being. Overall, we strive to create an excellent customer experience for each of our guests and residents.
Contact for available floor plans
Contact for available Payment Options
Neighborhood & Demographics
10 closest amenities
Show Map Show List
10 closest amenities
Grocery stores
Coffee shops
Gas Stations
Restaurants
Pharmacies
Financial services
Powered by 
DEMOGRAPHIC BREAKDOWN
35%
Single
Marital Status
47%
Married Couples
Community
74%
Drove By Themselves
Commute
4%
Below 9th Grade
Highest Level of Education
26%
Children
Adult vs. Children
12%
0-9
Population by Age
12%
0-9
Males by Age Distribution
11%
0-9
Females by Age Distribution
Males by Age Distribution
| Status | Percentage |
|---|---|
| 0-9 | 12% |
| 10-19 | 12% |
| 20-29 | 13% |
| 30-39 | 13% |
| 40-49 | 12% |
| 50-59 | 14% |
| 60-69 | 10% |
| 70-79 | 11% |
| 80 Above | 2% |
Females by Age Distribution
| Status | Percentage |
|---|---|
| 0-9 | 11% |
| 10-19 | 12% |
| 20-29 | 13% |
| 30-39 | 13% |
| 40-49 | 13% |
| 50-59 | 14% |
| 60-69 | 11% |
| 70-79 | 11% |
| 80 Above | 4% |
Marital Status
| Status | Percentage |
|---|---|
| Single | 35% |
| Married (Not Separated) | 47% |
| Separated | 2% |
| Widowed | 6% |
| Divorced | 10% |
Community
| Status | Percentage |
|---|---|
| Married Couples | 47% |
| Single Females | 14% |
| Single Males | 5% |
| Living Alone | 9% |
| Living With Family | 25% |
Commute
| Status | Percentage |
|---|---|
| Drove By Themselves | 74% |
| Public Transportation | 9% |
| Carpooled | 10% |
| Walked | 2% |
| Occasional Drive | 0% |
| Work At Home | 4% |
| Other | 1% |
Highest Level of Education
| Status | Percentage |
|---|---|
| Below 9th Grade | 4% |
| Bachelors Degree | 20% |
| High School | 26% |
| College | 20% |
| Associate Degree | 6% |
| 9th to 12th Grade | 7% |
| Graduate | 17% |
Adult vs. Children
| Status | Percentage |
|---|---|
| Children | 26% |
| Adult | 74% |
Population by Age
| Status | Percentage |
|---|---|
| 0-9 | 12% |
| 10-19 | 13% |
| 20-29 | 13% |
| 30-39 | 13% |
| 40-49 | 13% |
| 50-59 | 15% |
| 60-69 | 11% |
| 70-79 | 6% |
| 80 Above | 3% |
Males by Age Distribution
| Status | Percentage |
|---|---|
| 0-9 | 12% |
| 10-19 | 12% |
| 20-29 | 13% |
| 30-39 | 13% |
| 40-49 | 12% |
| 50-59 | 14% |
| 60-69 | 10% |
| 70-79 | 11% |
| 80 Above | 2% |
Females by Age Distribution
| Status | Percentage |
|---|---|
| 0-9 | 11% |
| 10-19 | 12% |
| 20-29 | 13% |
| 30-39 | 13% |
| 40-49 | 13% |
| 50-59 | 14% |
| 60-69 | 11% |
| 70-79 | 11% |
| 80 Above | 4% |
