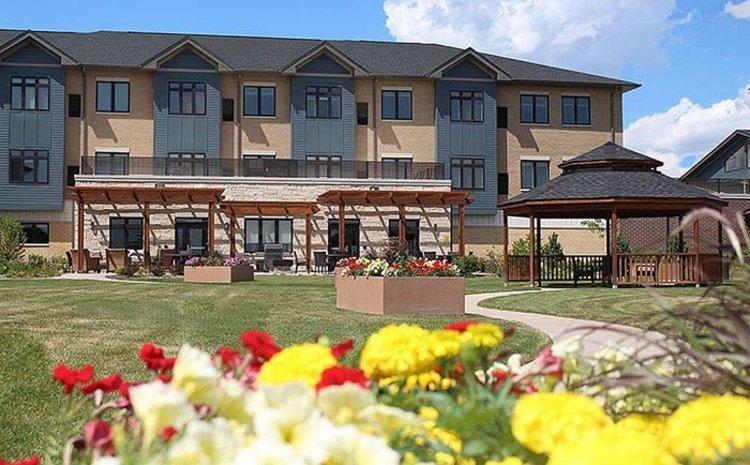
Evergreen Senior Living – Orland Park
$ Call for Rates
10820 183Rd Street, Orland Park, IL 60467
Overview
Care Types: Assisted Living, Alzheimer’s Care
Evergreen Senior Living is a community of care and friendship that provides an unmatched assisted living experience. The staff strives to maintain the dignity of its residents while providing them with opportunities for success and joy. Their programs are carefully created to encourage seniors to work on their skills and feel a sense of security by providing them with endless social opportunities. Residents can enjoy delicious dining destinations, as well as worry-free living on its beautiful campus.
Amenities
- 2-bedroom apartments
- English Language
- Free Transportation Services
- Guests Allowed at Meal Time
- Gym
- Housekeeping Services Available
- In-house Laundry and Drycleaning
- In-House Religious Services
- In-house Skilled Nursing
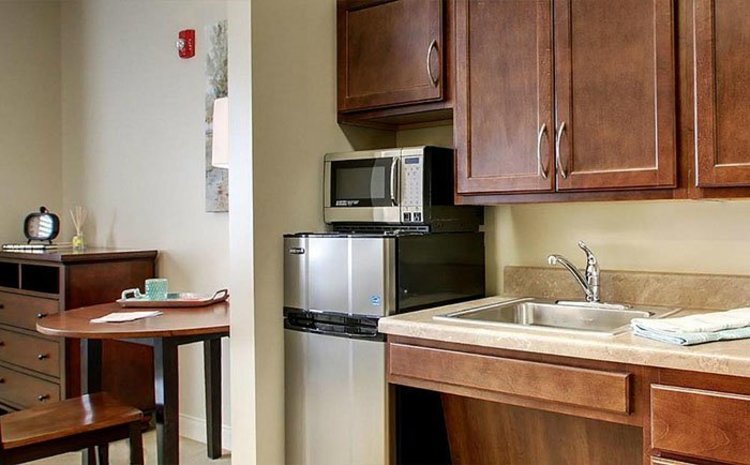
- Kitchenette in resident rooms
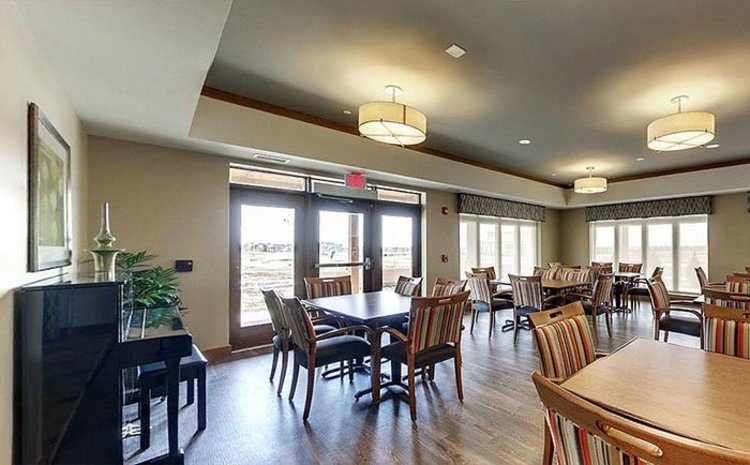
- Community Dining Available
- VA Benefits Assistance
- Financial Advice
- Laundry Services for Linens
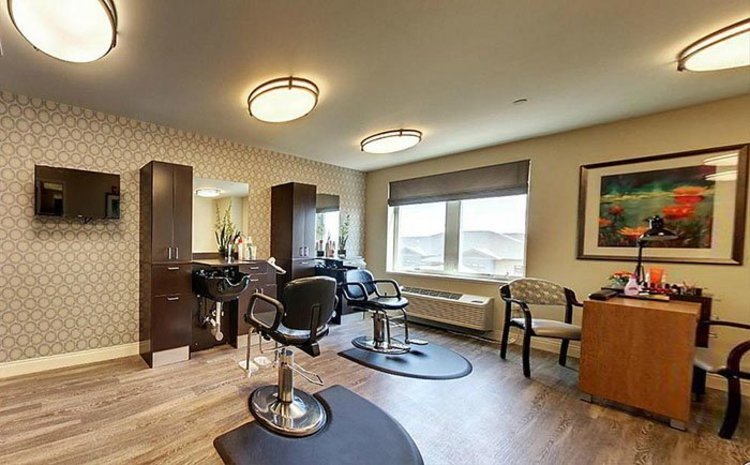
- On-site haircuts/barber services
- On-site Resident Parking
- Outdoor Patios and Gardens
- Room service available
- Licensed by the State
- Semi-Private Apartments/Rooms
- Single Room Units Available
- Skilled nursing services
- Some Pets Are Allowed
Contact for available floor plans
Contact for available Payment Options
Neighborhood & Demographics
DEMOGRAPHIC BREAKDOWN
35%
Single
Marital Status
48%
Married Couples
Community
73%
Drove By Themselves
Commute
6%
Below 9th Grade
Highest Level of Education
27%
Children
Adult vs. Children
12%
0-9
Population by Age
12%
0-9
Males by Age Distribution
11%
0-9
Females by Age Distribution
Males by Age Distribution
Status | Percentage |
---|---|
0-9 | 12% |
10-19 | 13% |
20-29 | 13% |
30-39 | 13% |
40-49 | 12% |
50-59 | 13% |
60-69 | 10% |
70-79 | 11% |
80 Above | 3% |
Females by Age Distribution
Status | Percentage |
---|---|
0-9 | 11% |
10-19 | 12% |
20-29 | 13% |
30-39 | 13% |
40-49 | 12% |
50-59 | 13% |
60-69 | 10% |
70-79 | 11% |
80 Above | 4% |
Marital Status
Status | Percentage |
---|---|
Single | 35% |
Married (Not Separated) | 47% |
Separated | 2% |
Widowed | 6% |
Divorced | 10% |
Community
Status | Percentage |
---|---|
Married Couples | 48% |
Single Females | 13% |
Single Males | 5% |
Living Alone | 10% |
Living With Family | 25% |
Commute
Status | Percentage |
---|---|
Drove By Themselves | 73% |
Public Transportation | 9% |
Carpooled | 9% |
Walked | 3% |
Occasional Drive | 0% |
Work At Home | 4% |
Other | 2% |
Highest Level of Education
Status | Percentage |
---|---|
Below 9th Grade | 6% |
Bachelors Degree | 20% |
High School | 27% |
College | 21% |
Associate Degree | 8% |
9th to 12th Grade | 7% |
Graduate | 12% |
Adult vs. Children
Status | Percentage |
---|---|
Children | 27% |
Adult | 73% |
Population by Age
Status | Percentage |
---|---|
0-9 | 12% |
10-19 | 14% |
20-29 | 13% |
30-39 | 14% |
40-49 | 13% |
50-59 | 14% |
60-69 | 11% |
70-79 | 6% |
80 Above | 4% |
Males by Age Distribution
Status | Percentage |
---|---|
0-9 | 12% |
10-19 | 13% |
20-29 | 13% |
30-39 | 13% |
40-49 | 12% |
50-59 | 13% |
60-69 | 10% |
70-79 | 11% |
80 Above | 3% |
Females by Age Distribution
Status | Percentage |
---|---|
0-9 | 11% |
10-19 | 12% |
20-29 | 13% |
30-39 | 13% |
40-49 | 12% |
50-59 | 13% |
60-69 | 10% |
70-79 | 11% |
80 Above | 4% |