Elgin Nursing and Rehabilitation Center
$ Call for Rates
1373 North Avenue C, Elgin, TX 78621
Overview
Care Types: Nursing Care
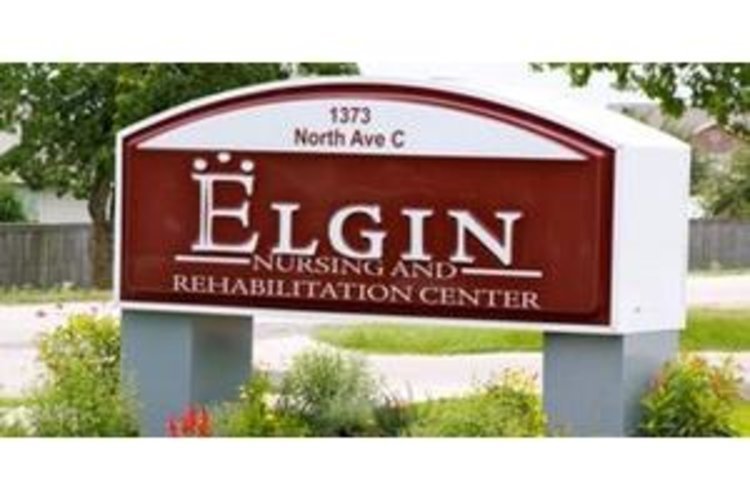
Welcome to Elgin Nursing and Rehabilitation Center
Providing skilled nursing and rehabilitation care to the Elgin community
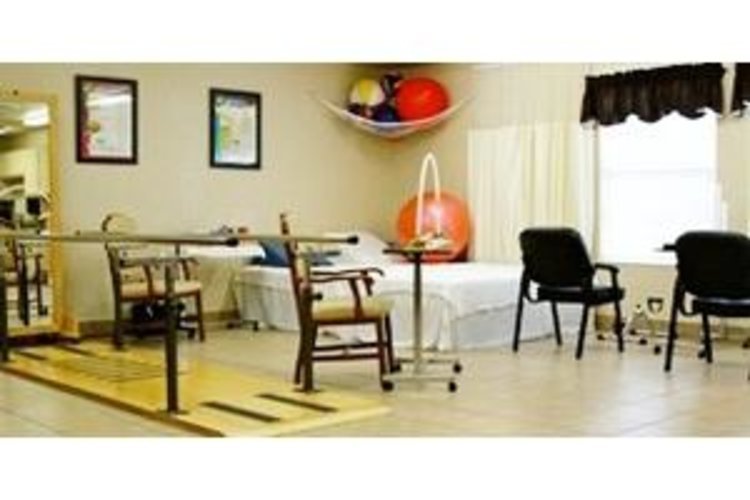
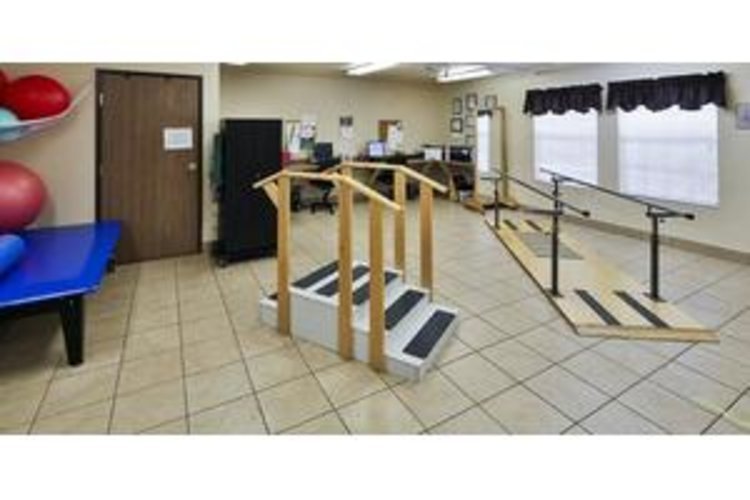
At Elgin Nursing and Rehabilitation Center our residents come first. Maintaining quality of life through skilled nursing and rehabilitation is what makes us proud. Wound Care, IV Therapy, Respiratory Care and an in-house rehabilitation team are a few select services that make our nursing home different. Unlike others who contract their therapists, Elgin Nursing and Rehabilitation Center has an in-house and full-time therapy team. This means our residents see the same occupational, speech or physical therapists daily, which builds a strong line of trust and rapport.
….
SHOW MORE
Long-term healthcare is changing, but Elgin Nursing and Rehabilitation is ahead of the curve. We understand that each patient has different needs and goals. Let us work with you and your loved ones to achieve the best quality of life attainable.
Contact for available floor plans
Contact for available Payment Options
Neighborhood & Demographics
DEMOGRAPHIC BREAKDOWN
33%
Single
Marital Status
51%
Married Couples
Community
80%
Drove By Themselves
Commute
9%
Below 9th Grade
Highest Level of Education
31%
Children
Adult vs. Children
15%
0-9
Population by Age
14%
0-9
Males by Age Distribution
14%
0-9
Females by Age Distribution
Males by Age Distribution
| Status | Percentage |
|---|---|
| 0-9 | 14% |
| 10-19 | 14% |
| 20-29 | 14% |
| 30-39 | 13% |
| 40-49 | 12% |
| 50-59 | 12% |
| 60-69 | 8% |
| 70-79 | 9% |
| 80 Above | 2% |
Females by Age Distribution
| Status | Percentage |
|---|---|
| 0-9 | 14% |
| 10-19 | 13% |
| 20-29 | 13% |
| 30-39 | 13% |
| 40-49 | 12% |
| 50-59 | 12% |
| 60-69 | 9% |
| 70-79 | 9% |
| 80 Above | 3% |
Marital Status
| Status | Percentage |
|---|---|
| Single | 33% |
| Married (Not Separated) | 49% |
| Separated | 3% |
| Widowed | 5% |
| Divorced | 11% |
Community
| Status | Percentage |
|---|---|
| Married Couples | 51% |
| Single Females | 14% |
| Single Males | 5% |
| Living Alone | 8% |
| Living With Family | 22% |
Commute
| Status | Percentage |
|---|---|
| Drove By Themselves | 80% |
| Public Transportation | 2% |
| Carpooled | 11% |
| Walked | 2% |
| Occasional Drive | 0% |
| Work At Home | 4% |
| Other | 2% |
Highest Level of Education
| Status | Percentage |
|---|---|
| Below 9th Grade | 9% |
| Bachelors Degree | 18% |
| High School | 25% |
| College | 23% |
| Associate Degree | 7% |
| 9th to 12th Grade | 9% |
| Graduate | 9% |
Adult vs. Children
| Status | Percentage |
|---|---|
| Children | 31% |
| Adult | 69% |
Population by Age
| Status | Percentage |
|---|---|
| 0-9 | 15% |
| 10-19 | 15% |
| 20-29 | 14% |
| 30-39 | 14% |
| 40-49 | 13% |
| 50-59 | 12% |
| 60-69 | 9% |
| 70-79 | 5% |
| 80 Above | 3% |
Males by Age Distribution
| Status | Percentage |
|---|---|
| 0-9 | 14% |
| 10-19 | 14% |
| 20-29 | 14% |
| 30-39 | 13% |
| 40-49 | 12% |
| 50-59 | 12% |
| 60-69 | 8% |
| 70-79 | 9% |
| 80 Above | 2% |
Females by Age Distribution
| Status | Percentage |
|---|---|
| 0-9 | 14% |
| 10-19 | 13% |
| 20-29 | 13% |
| 30-39 | 13% |
| 40-49 | 12% |
| 50-59 | 12% |
| 60-69 | 9% |
| 70-79 | 9% |
| 80 Above | 3% |