43.0394
-78.9796
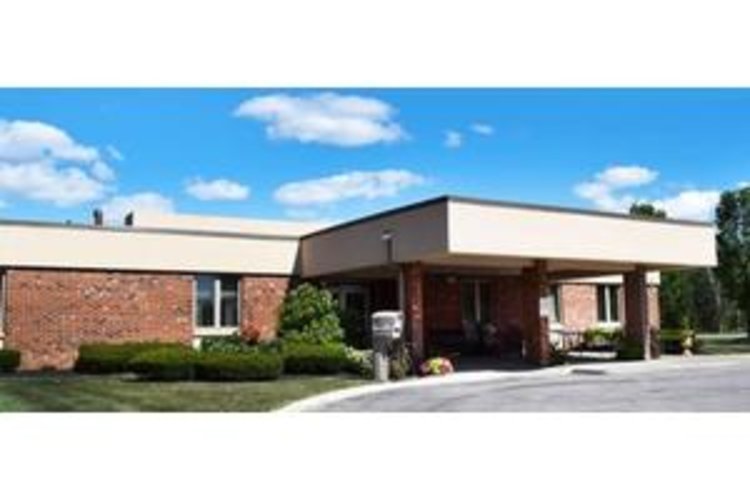
Elderwood at Grand Island
$ Call for Rates
2850 Grand Island Blvd, Grand Island, NY 14072
$ Call for Rates
2850 Grand Island Blvd, Grand Island, NY 14072
Care Types: Independent Living, Assisted Living, Nursing Care
Elderwood at Grand Island offers senior living options in Grand Island, NY. Situated near Niagara Falls, this community offers an exciting location with many amenities for visitors. I-190 runs right byElderwood, making it easy for family and friends to visit. Niagara Falls Memorial Medical Center is approximately 7 miles away.

39%
Single
Marital Status
43%
Married Couples
Community
54%
Drove By Themselves
Commute
7%
Below 9th Grade
Highest Level of Education
25%
Children
Adult vs. Children
12%
0-9
Population by Age
12%
0-9
Males by Age Distribution
11%
0-9
Females by Age Distribution
| Status | Percentage |
|---|---|
| 0-9 | 12% |
| 10-19 | 12% |
| 20-29 | 14% |
| 30-39 | 13% |
| 40-49 | 12% |
| 50-59 | 13% |
| 60-69 | 10% |
| 70-79 | 12% |
| 80 Above | 3% |
| Status | Percentage |
|---|---|
| 0-9 | 11% |
| 10-19 | 11% |
| 20-29 | 14% |
| 30-39 | 13% |
| 40-49 | 12% |
| 50-59 | 13% |
| 60-69 | 11% |
| 70-79 | 11% |
| 80 Above | 5% |
| Status | Percentage |
|---|---|
| Single | 39% |
| Married (Not Separated) | 44% |
| Separated | 3% |
| Widowed | 6% |
| Divorced | 9% |
| Status | Percentage |
|---|---|
| Married Couples | 43% |
| Single Females | 15% |
| Single Males | 5% |
| Living Alone | 11% |
| Living With Family | 27% |
| Status | Percentage |
|---|---|
| Drove By Themselves | 54% |
| Public Transportation | 27% |
| Carpooled | 7% |
| Walked | 6% |
| Occasional Drive | 0% |
| Work At Home | 4% |
| Other | 2% |
| Status | Percentage |
|---|---|
| Below 9th Grade | 7% |
| Bachelors Degree | 19% |
| High School | 27% |
| College | 16% |
| Associate Degree | 8% |
| 9th to 12th Grade | 8% |
| Graduate | 15% |
| Status | Percentage |
|---|---|
| Children | 25% |
| Adult | 75% |
| Status | Percentage |
|---|---|
| 0-9 | 12% |
| 10-19 | 13% |
| 20-29 | 14% |
| 30-39 | 13% |
| 40-49 | 13% |
| 50-59 | 14% |
| 60-69 | 11% |
| 70-79 | 6% |
| 80 Above | 4% |
| Status | Percentage |
|---|---|
| 0-9 | 12% |
| 10-19 | 12% |
| 20-29 | 14% |
| 30-39 | 13% |
| 40-49 | 12% |
| 50-59 | 13% |
| 60-69 | 10% |
| 70-79 | 12% |
| 80 Above | 3% |
| Status | Percentage |
|---|---|
| 0-9 | 11% |
| 10-19 | 11% |
| 20-29 | 14% |
| 30-39 | 13% |
| 40-49 | 12% |
| 50-59 | 13% |
| 60-69 | 11% |
| 70-79 | 11% |
| 80 Above | 5% |
By clicking “Request Info” you agree to our Terms of Use and Privacy Policy. You also consent to receive texts and calls, which may be autodialed, from us and our partner providers; however, your consent is not a condition to using our service.

By clicking “Request Info”, you agree to our Terms of Use, our Privacy Policy, and our Agreement to be Contacted by Telephone. You also consent that we, or our partner providers, may reach out to you about senior living solutions or Medicare insurance using a system that can auto-dial; however, you do not need to consent to this to use our service.