Dover Center for Health & Rehabilitation
$ Call for Rates
307 Plaza Drive, Dover, NH 03820
Overview
Care Types: Home Care, Memory Care, Retirement, Assisted Living
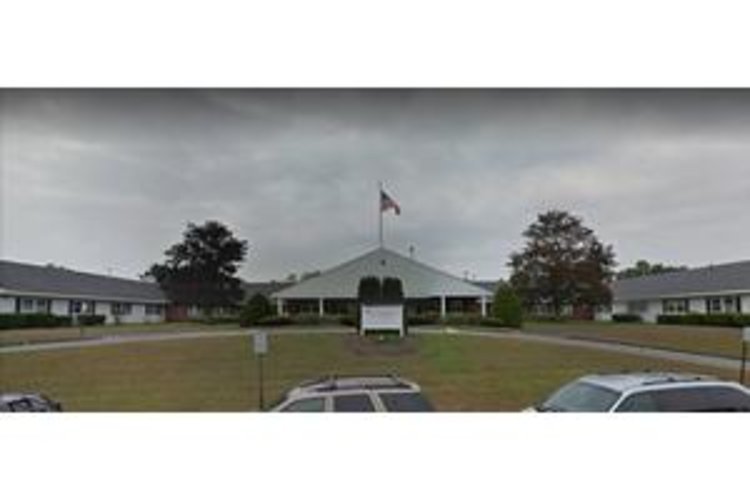
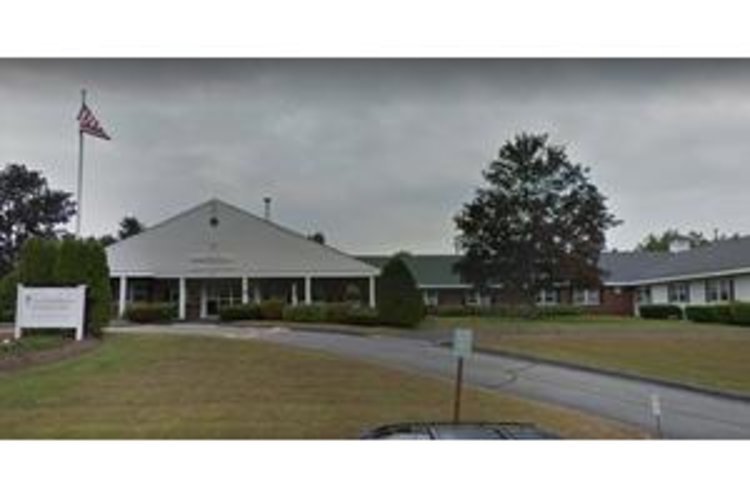
Dover Center for Health & Rehabilitation caters to individuals who require care after hospitalization or those who need long-term nursing care. The community is situated conveniently close to the Wentworth-Douglass Hospital.
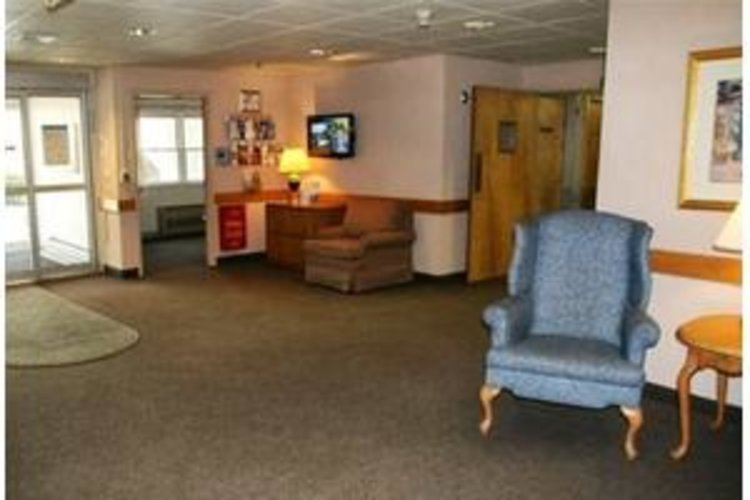
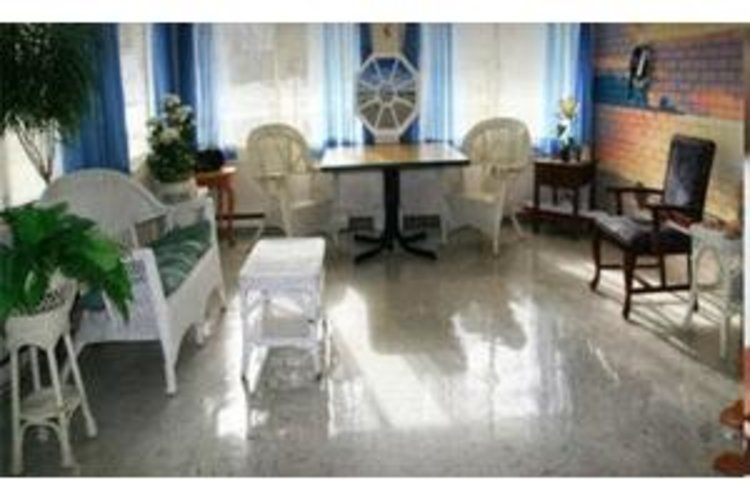
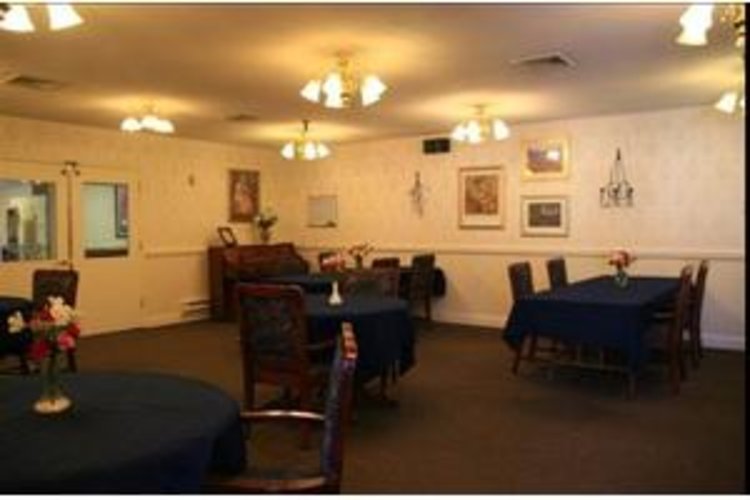
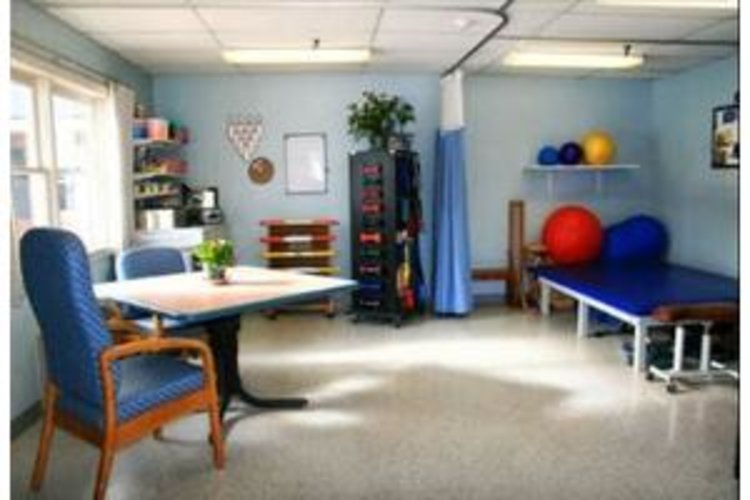
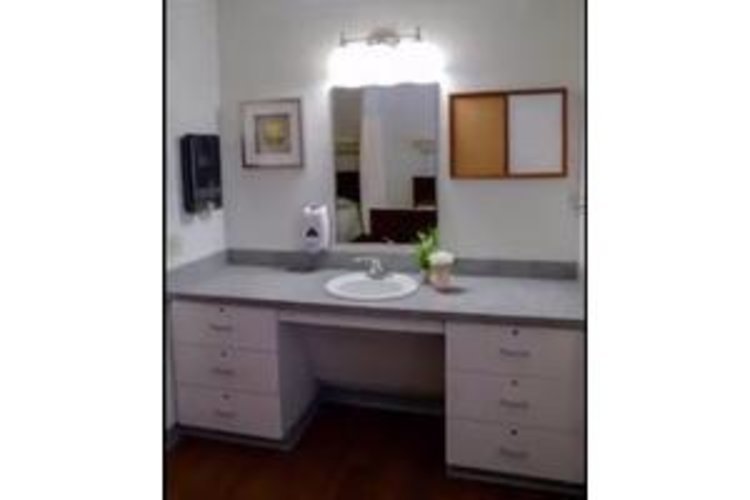
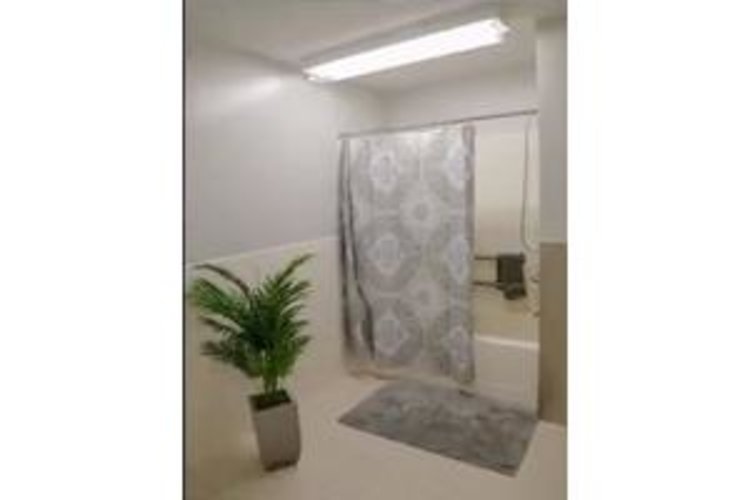
Dover Center for Health & Rehabilitation creates a home-like environment for residents in finely appointed accommodations. It aims to treat residents as family members and its professional staff provides one-to-one support and guidance. The center provides pulmonary rehabilitation, cardiac recovery, amputee and stroke rehabilitation and wound care. Its heart failure program provides education and evaluates the underlying causes of heart failure, suggesting medications and lifestyle modifications. The community’s staff sees that all residents receive constant support and one-on-one care. …. SHOW MORE
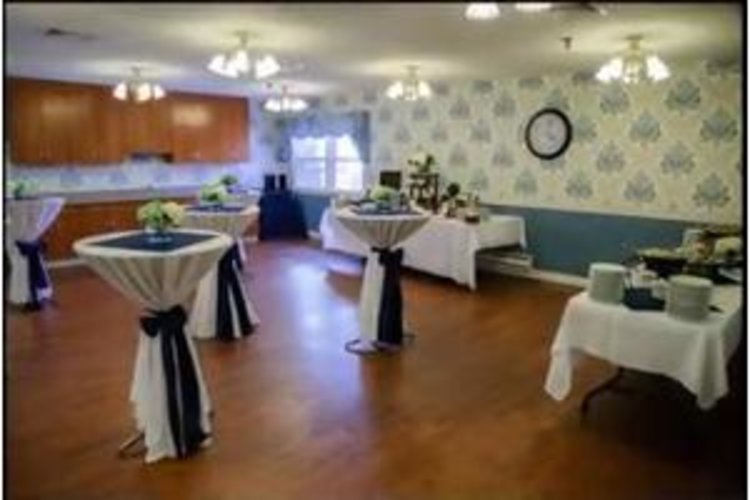
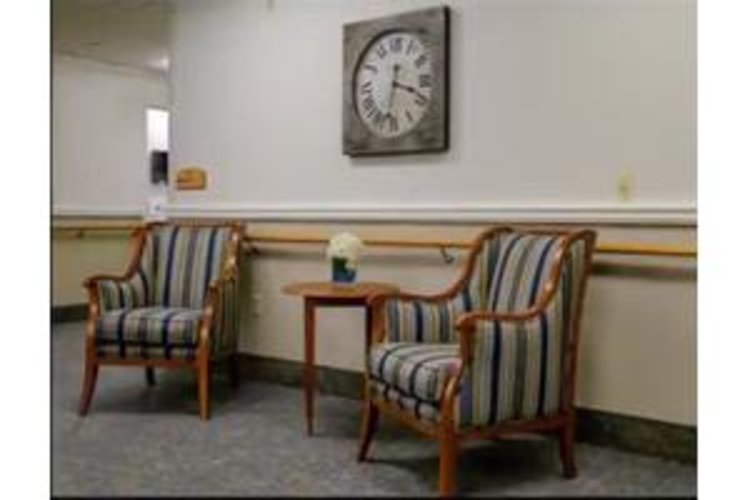
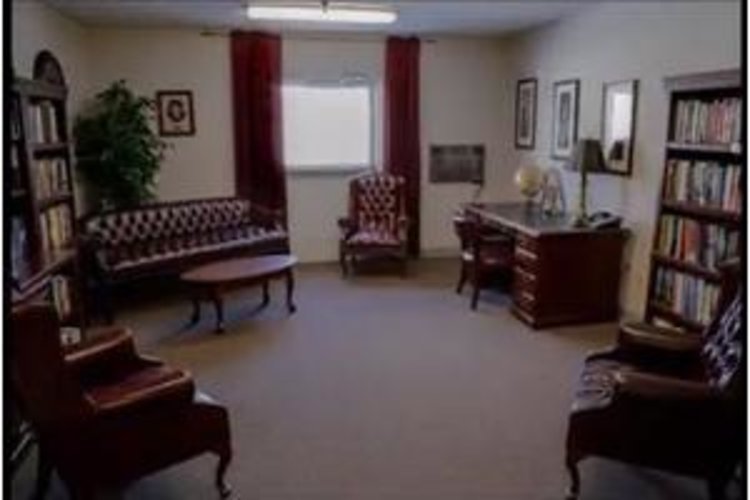
Community amenities include a beauty salon, daily laundry and housekeeping services, dining services and lounges. Activities that keep residents engaged include arts and crafts classes, trips, cooking groups, gardening, entertainment and outings to local restaurants.
SHOW LESSContact for available floor plans
Contact for available Payment Options
Neighborhood & Demographics
DEMOGRAPHIC BREAKDOWN
30%
Single
Marital Status
52%
Married Couples
Community
81%
Drove By Themselves
Commute
3%
Below 9th Grade
Highest Level of Education
24%
Children
Adult vs. Children
10%
0-9
Population by Age
10%
0-9
Males by Age Distribution
9%
0-9
Females by Age Distribution
Males by Age Distribution
Status | Percentage |
---|---|
0-9 | 10% |
10-19 | 12% |
20-29 | 12% |
30-39 | 11% |
40-49 | 12% |
50-59 | 15% |
60-69 | 12% |
70-79 | 13% |
80 Above | 3% |
Females by Age Distribution
Status | Percentage |
---|---|
0-9 | 9% |
10-19 | 12% |
20-29 | 11% |
30-39 | 10% |
40-49 | 13% |
50-59 | 16% |
60-69 | 12% |
70-79 | 13% |
80 Above | 4% |
Marital Status
Status | Percentage |
---|---|
Single | 30% |
Married (Not Separated) | 51% |
Separated | 1% |
Widowed | 6% |
Divorced | 12% |
Community
Status | Percentage |
---|---|
Married Couples | 52% |
Single Females | 9% |
Single Males | 4% |
Living Alone | 9% |
Living With Family | 25% |
Commute
Status | Percentage |
---|---|
Drove By Themselves | 81% |
Public Transportation | 1% |
Carpooled | 8% |
Walked | 3% |
Occasional Drive | 0% |
Work At Home | 6% |
Other | 1% |
Highest Level of Education
Status | Percentage |
---|---|
Below 9th Grade | 3% |
Bachelors Degree | 22% |
High School | 29% |
College | 19% |
Associate Degree | 10% |
9th to 12th Grade | 5% |
Graduate | 13% |
Adult vs. Children
Status | Percentage |
---|---|
Children | 24% |
Adult | 76% |
Population by Age
Status | Percentage |
---|---|
0-9 | 10% |
10-19 | 13% |
20-29 | 12% |
30-39 | 11% |
40-49 | 14% |
50-59 | 17% |
60-69 | 13% |
70-79 | 7% |
80 Above | 4% |
Males by Age Distribution
Status | Percentage |
---|---|
0-9 | 10% |
10-19 | 12% |
20-29 | 12% |
30-39 | 11% |
40-49 | 12% |
50-59 | 15% |
60-69 | 12% |
70-79 | 13% |
80 Above | 3% |
Females by Age Distribution
Status | Percentage |
---|---|
0-9 | 9% |
10-19 | 12% |
20-29 | 11% |
30-39 | 10% |
40-49 | 13% |
50-59 | 16% |
60-69 | 12% |
70-79 | 13% |
80 Above | 4% |