

Cortlandt Healthcare
$ Call for Rates
110 OREGON ROAD, Cortlandt Manor, NY 10567
Overview
Care Types: Nursing Care
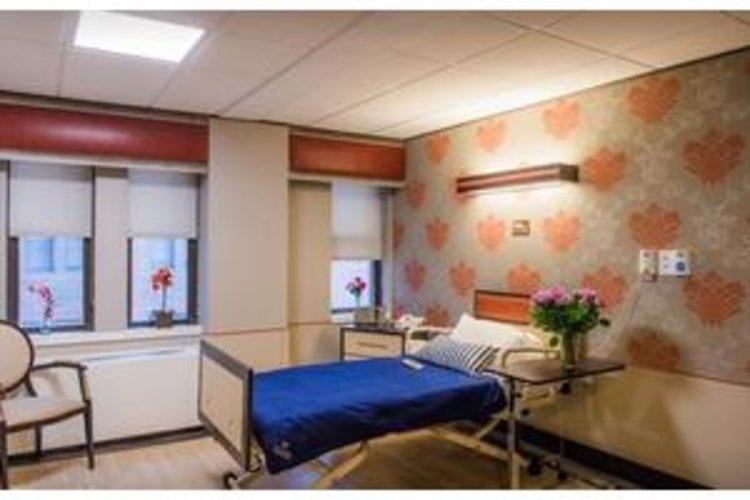
Welcome to Cortlandt Healthcare! Nestled amongst ancient maple trees in the historic village of Cortlandt Manor, Cortlandt Healthcare has provided outstanding care to the community for over fifty years.
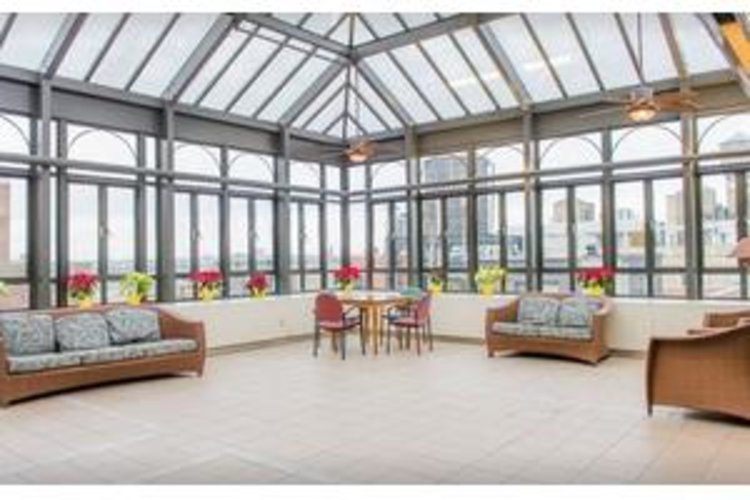
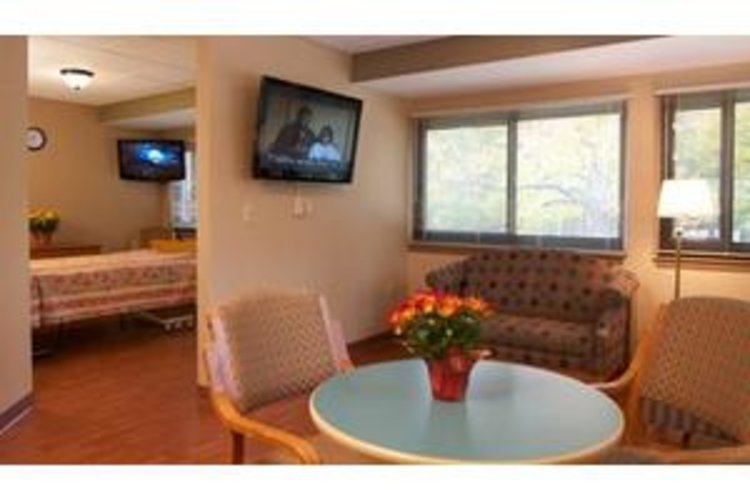
OUR MISSION is to foster and provide unprecedented levels of genuine care and customer service for our community’s Rehabilitation and Nursing needs, in a soothing, tranquil and state-of-the-art environment.
The Cortlandt Healthcare experience enlivens our guests’ physical and emotional strength through cutting-edge technology and highly trained healthcare professionals to get them back to their fullest potential of ReNEWal™.
Our employees are the vital link; they are the core of excellence in the care and compassion we are committed to, striving to fulfill the expressed and unexpressed wishes and needs of our guests and their families daily. They are therefore our most precious resource.
Contact for available floor plans
Contact for available Payment Options
Neighborhood & Demographics

DEMOGRAPHIC BREAKDOWN
39%
Single
Marital Status
43%
Married Couples
Community
54%
Drove By Themselves
Commute
7%
Below 9th Grade
Highest Level of Education
25%
Children
Adult vs. Children
12%
0-9
Population by Age
12%
0-9
Males by Age Distribution
11%
0-9
Females by Age Distribution
Males by Age Distribution
| Status | Percentage |
|---|---|
| 0-9 | 12% |
| 10-19 | 12% |
| 20-29 | 14% |
| 30-39 | 13% |
| 40-49 | 12% |
| 50-59 | 13% |
| 60-69 | 10% |
| 70-79 | 12% |
| 80 Above | 3% |
Females by Age Distribution
| Status | Percentage |
|---|---|
| 0-9 | 11% |
| 10-19 | 11% |
| 20-29 | 14% |
| 30-39 | 13% |
| 40-49 | 12% |
| 50-59 | 13% |
| 60-69 | 11% |
| 70-79 | 11% |
| 80 Above | 5% |
Marital Status
| Status | Percentage |
|---|---|
| Single | 39% |
| Married (Not Separated) | 44% |
| Separated | 3% |
| Widowed | 6% |
| Divorced | 9% |
Community
| Status | Percentage |
|---|---|
| Married Couples | 43% |
| Single Females | 15% |
| Single Males | 5% |
| Living Alone | 11% |
| Living With Family | 27% |
Commute
| Status | Percentage |
|---|---|
| Drove By Themselves | 54% |
| Public Transportation | 27% |
| Carpooled | 7% |
| Walked | 6% |
| Occasional Drive | 0% |
| Work At Home | 4% |
| Other | 2% |
Highest Level of Education
| Status | Percentage |
|---|---|
| Below 9th Grade | 7% |
| Bachelors Degree | 19% |
| High School | 27% |
| College | 16% |
| Associate Degree | 8% |
| 9th to 12th Grade | 8% |
| Graduate | 15% |
Adult vs. Children
| Status | Percentage |
|---|---|
| Children | 25% |
| Adult | 75% |
Population by Age
| Status | Percentage |
|---|---|
| 0-9 | 12% |
| 10-19 | 13% |
| 20-29 | 14% |
| 30-39 | 13% |
| 40-49 | 13% |
| 50-59 | 14% |
| 60-69 | 11% |
| 70-79 | 6% |
| 80 Above | 4% |
Males by Age Distribution
| Status | Percentage |
|---|---|
| 0-9 | 12% |
| 10-19 | 12% |
| 20-29 | 14% |
| 30-39 | 13% |
| 40-49 | 12% |
| 50-59 | 13% |
| 60-69 | 10% |
| 70-79 | 12% |
| 80 Above | 3% |
Females by Age Distribution
| Status | Percentage |
|---|---|
| 0-9 | 11% |
| 10-19 | 11% |
| 20-29 | 14% |
| 30-39 | 13% |
| 40-49 | 12% |
| 50-59 | 13% |
| 60-69 | 11% |
| 70-79 | 11% |
| 80 Above | 5% |
