


Cliveden Convalescent Center
$ Call for Rates
6400 GREENE STREET, Philadelphia, PA 19119
Overview
Care Types: Nursing Care, Assisted Living
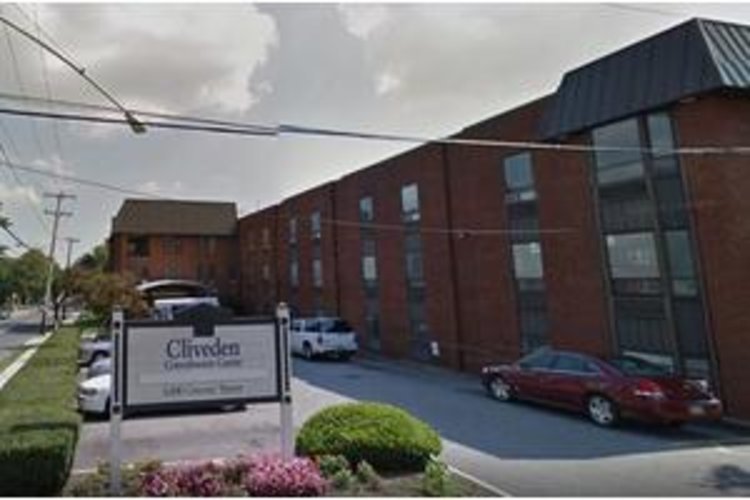
Cliveden Nursing and Rehabilitation Center
Cliveden Nursing and Rehabilitation Center is in northwest Philadelphia, near historic and charming Germantown. It’s conveniently located close to retail, dining, and other amenities, with easy access to public transportation. There are five hospitals within 3 miles of the center, including Roxborough Hospital, Albert Einstein Medical, and Chestnut Hill Hospital.
Cliveden Nursing and Rehabilitation Center offers both short-term post-acute rehabilitation and long-term skilled nursing care. The center provides around-the-clock comprehensive care. Its specialties include physical, occupational, and speech therapy, IV therapy, and wound, pulmonary, tracheostomy, and cardiac care. Hospice and palliative care are also available. …. SHOW MORE
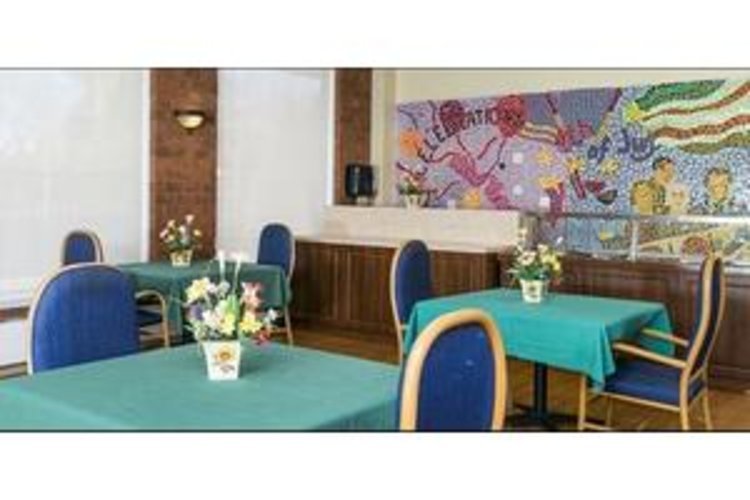
There are 180 beds at the center. Amenities include dining services, concierge services, Wi-Fi, flat screen TVs, and an on-site salon and barbershop. Residents can stroll around the beautiful grounds and common areas and can take part in a variety of personalized activities.
SHOW LESSContact for available floor plans
Contact for available Payment Options
Neighborhood & Demographics

DEMOGRAPHIC BREAKDOWN
34%
Single
Marital Status
46%
Married Couples
Community
77%
Drove By Themselves
Commute
4%
Below 9th Grade
Highest Level of Education
25%
Children
Adult vs. Children
11%
0-9
Population by Age
11%
0-9
Males by Age Distribution
10%
0-9
Females by Age Distribution
Males by Age Distribution
| Status | Percentage |
|---|---|
| 0-9 | 11% |
| 10-19 | 12% |
| 20-29 | 13% |
| 30-39 | 11% |
| 40-49 | 12% |
| 50-59 | 14% |
| 60-69 | 11% |
| 70-79 | 13% |
| 80 Above | 3% |
Females by Age Distribution
| Status | Percentage |
|---|---|
| 0-9 | 10% |
| 10-19 | 11% |
| 20-29 | 12% |
| 30-39 | 11% |
| 40-49 | 12% |
| 50-59 | 14% |
| 60-69 | 12% |
| 70-79 | 13% |
| 80 Above | 6% |
Marital Status
| Status | Percentage |
|---|---|
| Single | 34% |
| Married (Not Separated) | 48% |
| Separated | 2% |
| Widowed | 7% |
| Divorced | 10% |
Community
| Status | Percentage |
|---|---|
| Married Couples | 46% |
| Single Females | 11% |
| Single Males | 4% |
| Living Alone | 11% |
| Living With Family | 27% |
Commute
| Status | Percentage |
|---|---|
| Drove By Themselves | 77% |
| Public Transportation | 5% |
| Carpooled | 9% |
| Walked | 4% |
| Occasional Drive | 0% |
| Work At Home | 4% |
| Other | 1% |
Highest Level of Education
| Status | Percentage |
|---|---|
| Below 9th Grade | 4% |
| Bachelors Degree | 17% |
| High School | 37% |
| College | 16% |
| Associate Degree | 8% |
| 9th to 12th Grade | 7% |
| Graduate | 11% |
Adult vs. Children
| Status | Percentage |
|---|---|
| Children | 25% |
| Adult | 75% |
Population by Age
| Status | Percentage |
|---|---|
| 0-9 | 11% |
| 10-19 | 13% |
| 20-29 | 13% |
| 30-39 | 12% |
| 40-49 | 13% |
| 50-59 | 15% |
| 60-69 | 12% |
| 70-79 | 7% |
| 80 Above | 5% |
Males by Age Distribution
| Status | Percentage |
|---|---|
| 0-9 | 11% |
| 10-19 | 12% |
| 20-29 | 13% |
| 30-39 | 11% |
| 40-49 | 12% |
| 50-59 | 14% |
| 60-69 | 11% |
| 70-79 | 13% |
| 80 Above | 3% |
Females by Age Distribution
| Status | Percentage |
|---|---|
| 0-9 | 10% |
| 10-19 | 11% |
| 20-29 | 12% |
| 30-39 | 11% |
| 40-49 | 12% |
| 50-59 | 14% |
| 60-69 | 12% |
| 70-79 | 13% |
| 80 Above | 6% |
