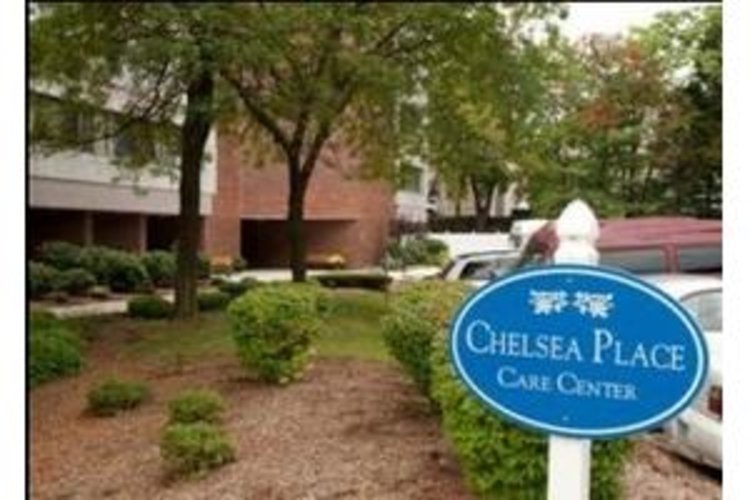


Chelsea Place Care Center LLC
$ Call for Rates
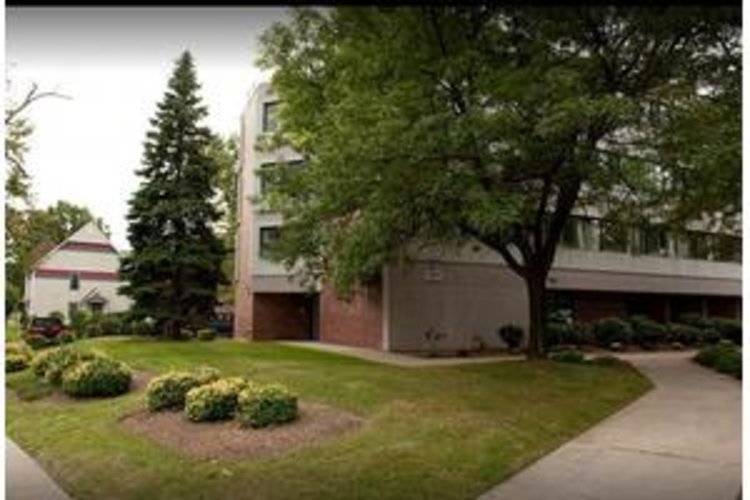
24 Lorraine St, Hartford, CT 06105
Overview
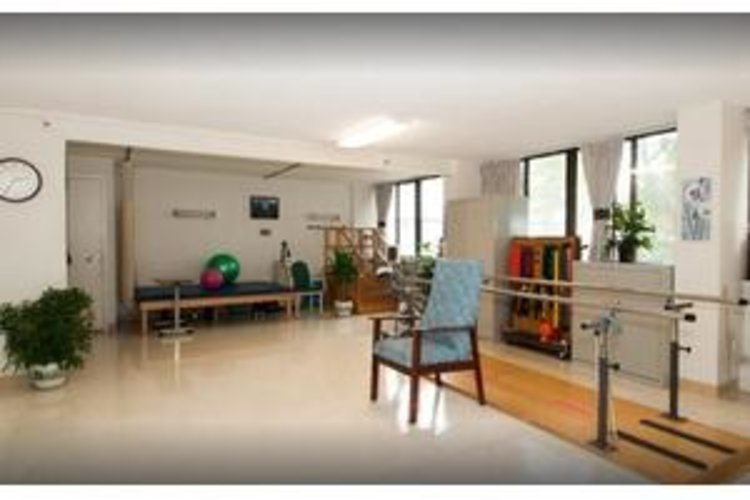
Care Types: Nursing Care, Memory Care
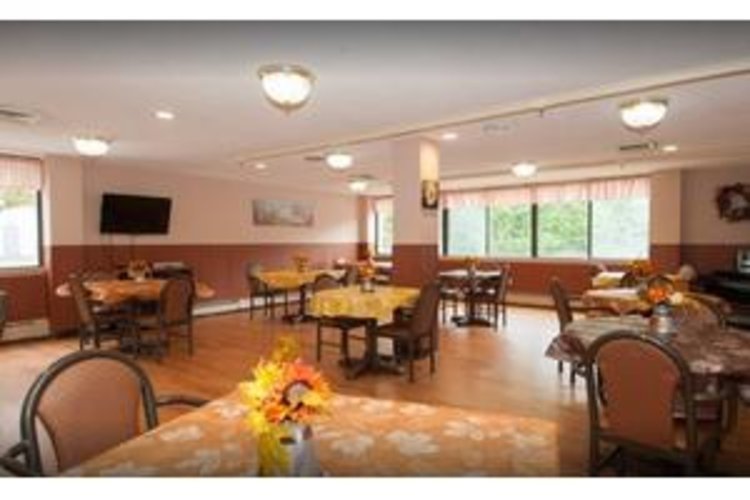
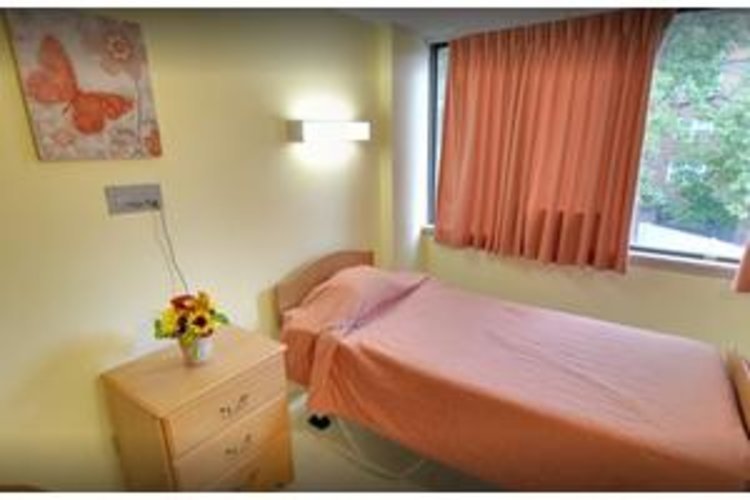
Welcome to Chelsea Place Care Center LLC! I would like to welcome you to Chelsea Place Care Center. Chelsea Place is located in the West end of Hartford in the Mark Twain neighborhood. At Chelsea we celebrate our diversity in our customers and our staff. It’s through this diversity that we are able to more effectively meet the healthcare challenges of our community. Chelsea Place has a broad scope of services, but despite having such a broad base we strongly encourage all of our staff to get to know all of the residents, their interests, needs and personalities. It is through this approach that has allowed us to be so successful with our clinical operations. Our ability to retain knowledgeable and skilled professionals has contributed greatly towards our continuing improvement and success. This success has allowed us to partner with other leading healthcare organizations across the state.
The approaches we take in our daily and interdepartmental operations always place resident dignity in the forefront. By ensuring that we incorporate respect into our treatment and education of our residents and their families we are more likely to produce positive outcomes for them. Our mission to, Enrich the lives of the residents we serve holds prominence in how we conduct our care and services, utilizing our resources ethically and conscientiously.
Contact for available floor plans
Contact for available Payment Options
Neighborhood & Demographics

DEMOGRAPHIC BREAKDOWN
35%
Single
Marital Status
47%
Married Couples
Community
79%
Drove By Themselves
Commute
4%
Below 9th Grade
Highest Level of Education
26%
Children
Adult vs. Children
11%
0-9
Population by Age
11%
0-9
Males by Age Distribution
10%
0-9
Females by Age Distribution
Males by Age Distribution
| Status | Percentage |
|---|---|
| 0-9 | 11% |
| 10-19 | 13% |
| 20-29 | 13% |
| 30-39 | 12% |
| 40-49 | 12% |
| 50-59 | 14% |
| 60-69 | 10% |
| 70-79 | 12% |
| 80 Above | 3% |
Females by Age Distribution
| Status | Percentage |
|---|---|
| 0-9 | 10% |
| 10-19 | 12% |
| 20-29 | 12% |
| 30-39 | 11% |
| 40-49 | 13% |
| 50-59 | 15% |
| 60-69 | 11% |
| 70-79 | 12% |
| 80 Above | 5% |
Marital Status
| Status | Percentage |
|---|---|
| Single | 35% |
| Married (Not Separated) | 47% |
| Separated | 1% |
| Widowed | 6% |
| Divorced | 11% |
Community
| Status | Percentage |
|---|---|
| Married Couples | 47% |
| Single Females | 12% |
| Single Males | 4% |
| Living Alone | 11% |
| Living With Family | 26% |
Commute
| Status | Percentage |
|---|---|
| Drove By Themselves | 79% |
| Public Transportation | 5% |
| Carpooled | 8% |
| Walked | 3% |
| Occasional Drive | 0% |
| Work At Home | 4% |
| Other | 1% |
Highest Level of Education
| Status | Percentage |
|---|---|
| Below 9th Grade | 4% |
| Bachelors Degree | 21% |
| High School | 28% |
| College | 18% |
| Associate Degree | 7% |
| 9th to 12th Grade | 6% |
| Graduate | 16% |
Adult vs. Children
| Status | Percentage |
|---|---|
| Children | 26% |
| Adult | 74% |
Population by Age
| Status | Percentage |
|---|---|
| 0-9 | 11% |
| 10-19 | 14% |
| 20-29 | 12% |
| 30-39 | 12% |
| 40-49 | 13% |
| 50-59 | 15% |
| 60-69 | 11% |
| 70-79 | 6% |
| 80 Above | 4% |
Males by Age Distribution
| Status | Percentage |
|---|---|
| 0-9 | 11% |
| 10-19 | 13% |
| 20-29 | 13% |
| 30-39 | 12% |
| 40-49 | 12% |
| 50-59 | 14% |
| 60-69 | 10% |
| 70-79 | 12% |
| 80 Above | 3% |
Females by Age Distribution
| Status | Percentage |
|---|---|
| 0-9 | 10% |
| 10-19 | 12% |
| 20-29 | 12% |
| 30-39 | 11% |
| 40-49 | 13% |
| 50-59 | 15% |
| 60-69 | 11% |
| 70-79 | 12% |
| 80 Above | 5% |
