Cashmere Convalescent Center
$ Call for Rates
817 PIONEER AVENUE, Cashmere, WA 98815
Overview
Care Types: Nursing Care
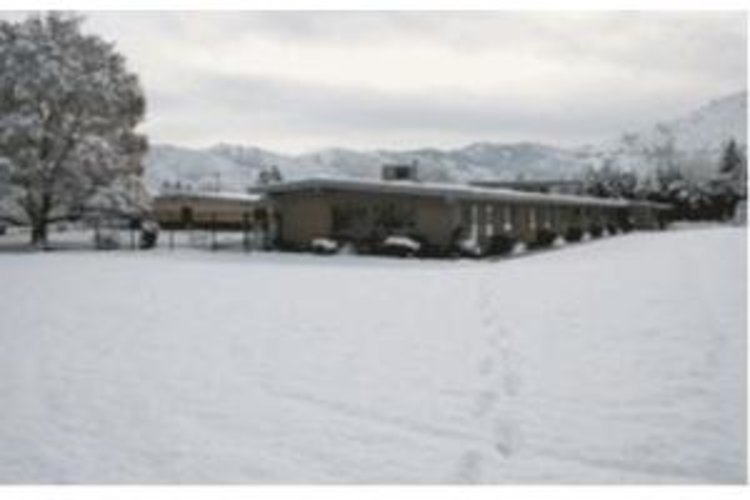
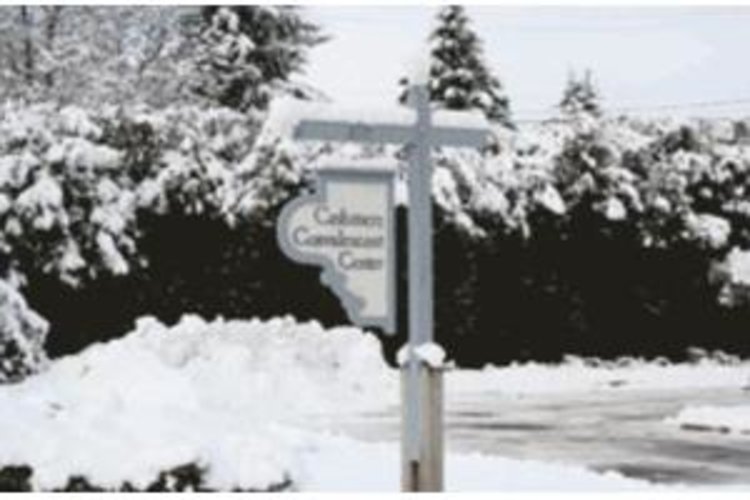
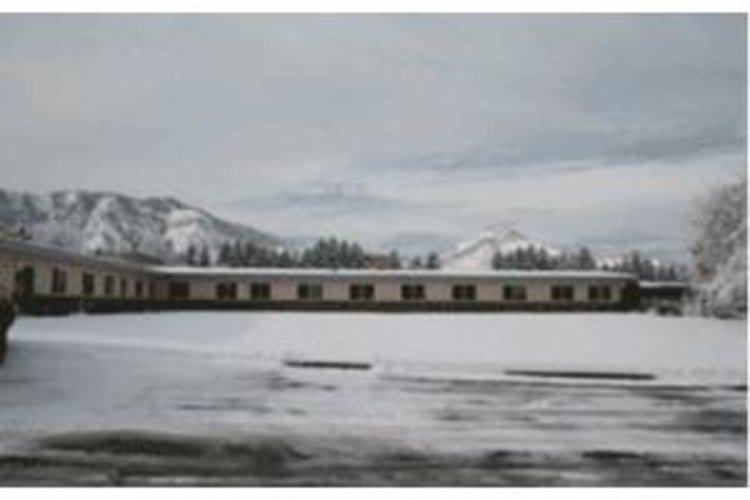
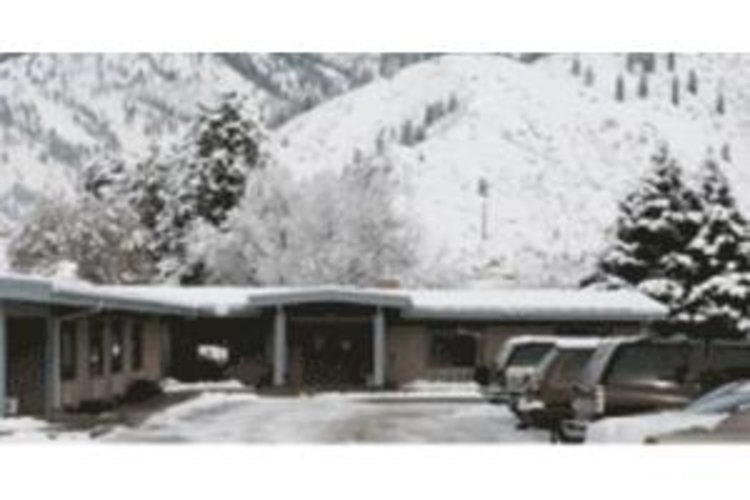
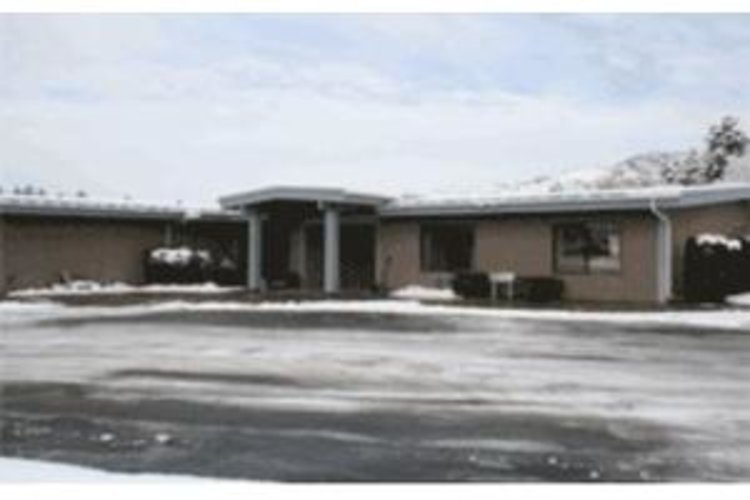
Welcome to Cashmere Convalescent Center! The Cashmere Convalescent Center is a full-care facility located in the beautiful foothills of the Cascade mountains in Cashmere, WA.
Cashmere Convalescent Center is proud of it’s 59 year tradition of caring. Operated by the Dronen Family and a highly dedicated staff, our facility is located just outside the Early American city of Cashmere in Washington State.
We can offer you, or your loved one a secure, therapeutic environment made possible by a caring and well-trained staff.
Our mission at Cashmere Convalescent Center is to provide a supportive, nurturing environment, honoring the uniqueness of each individual. Our success is measured by our collective commitment to the highest standards, which embody respect, honesty without waiver, genuine love and integrity.
Contact for available floor plans
Contact for available Payment Options
Neighborhood & Demographics
DEMOGRAPHIC BREAKDOWN
31%
Single
Marital Status
51%
Married Couples
Community
73%
Drove By Themselves
Commute
4%
Below 9th Grade
Highest Level of Education
26%
Children
Adult vs. Children
13%
0-9
Population by Age
12%
0-9
Males by Age Distribution
12%
0-9
Females by Age Distribution
Males by Age Distribution
Status | Percentage |
---|---|
0-9 | 12% |
10-19 | 12% |
20-29 | 14% |
30-39 | 13% |
40-49 | 12% |
50-59 | 13% |
60-69 | 10% |
70-79 | 11% |
80 Above | 2% |
Females by Age Distribution
Status | Percentage |
---|---|
0-9 | 12% |
10-19 | 11% |
20-29 | 13% |
30-39 | 13% |
40-49 | 12% |
50-59 | 13% |
60-69 | 11% |
70-79 | 11% |
80 Above | 4% |
Marital Status
Status | Percentage |
---|---|
Single | 31% |
Married (Not Separated) | 50% |
Separated | 2% |
Widowed | 5% |
Divorced | 12% |
Community
Status | Percentage |
---|---|
Married Couples | 51% |
Single Females | 11% |
Single Males | 5% |
Living Alone | 10% |
Living With Family | 25% |
Commute
Status | Percentage |
---|---|
Drove By Themselves | 73% |
Public Transportation | 6% |
Carpooled | 10% |
Walked | 3% |
Occasional Drive | 0% |
Work At Home | 5% |
Other | 2% |
Highest Level of Education
Status | Percentage |
---|---|
Below 9th Grade | 4% |
Bachelors Degree | 21% |
High School | 23% |
College | 25% |
Associate Degree | 10% |
9th to 12th Grade | 6% |
Graduate | 12% |
Adult vs. Children
Status | Percentage |
---|---|
Children | 26% |
Adult | 74% |
Population by Age
Status | Percentage |
---|---|
0-9 | 13% |
10-19 | 13% |
20-29 | 14% |
30-39 | 14% |
40-49 | 13% |
50-59 | 14% |
60-69 | 11% |
70-79 | 6% |
80 Above | 3% |
Males by Age Distribution
Status | Percentage |
---|---|
0-9 | 12% |
10-19 | 12% |
20-29 | 14% |
30-39 | 13% |
40-49 | 12% |
50-59 | 13% |
60-69 | 10% |
70-79 | 11% |
80 Above | 2% |
Females by Age Distribution
Status | Percentage |
---|---|
0-9 | 12% |
10-19 | 11% |
20-29 | 13% |
30-39 | 13% |
40-49 | 12% |
50-59 | 13% |
60-69 | 11% |
70-79 | 11% |
80 Above | 4% |