Candlewood Valley Health and Rehabilitation Center
$ Call for Rates
30 Park Lane East, New Milford, CT 06776
Overview
Care Types: Nursing Care, Memory Care, Assisted Living
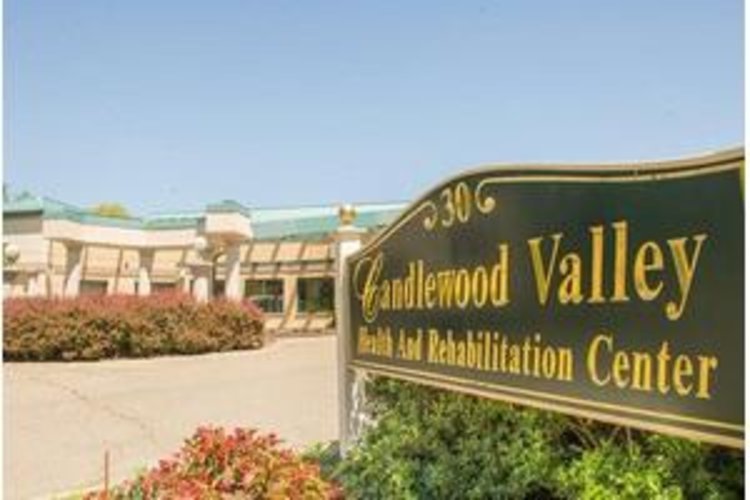
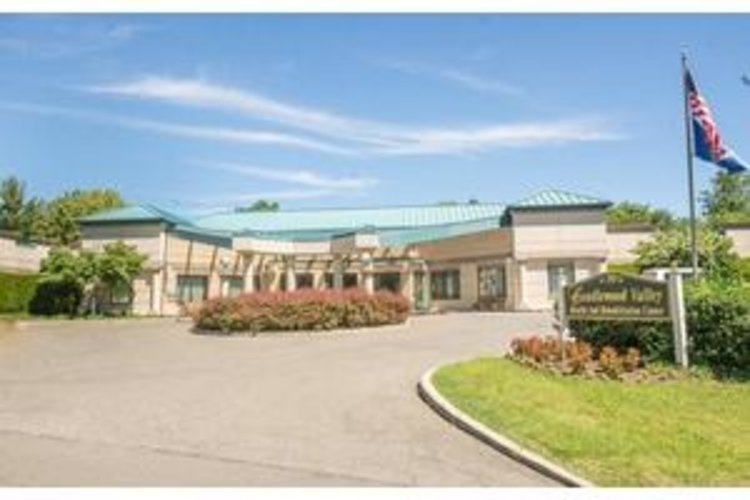
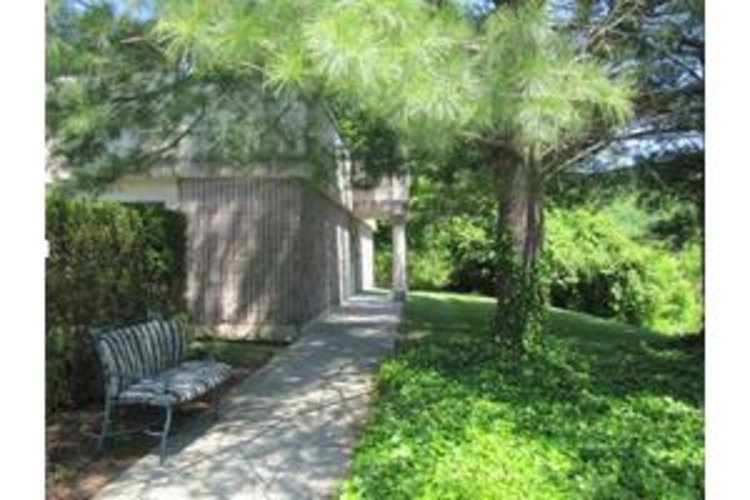
Candlewood Valley Health & Rehabilitation Center is located in a quiet residential area in the north of New Milford, Connecticut. Sitting along the Housatonic River, New Milford offers beautiful nature and excellent amenities, including shops, restaurants and churches. The town has a range of medical facilities, including New Milford Hospital and New Milford Medical Group.;
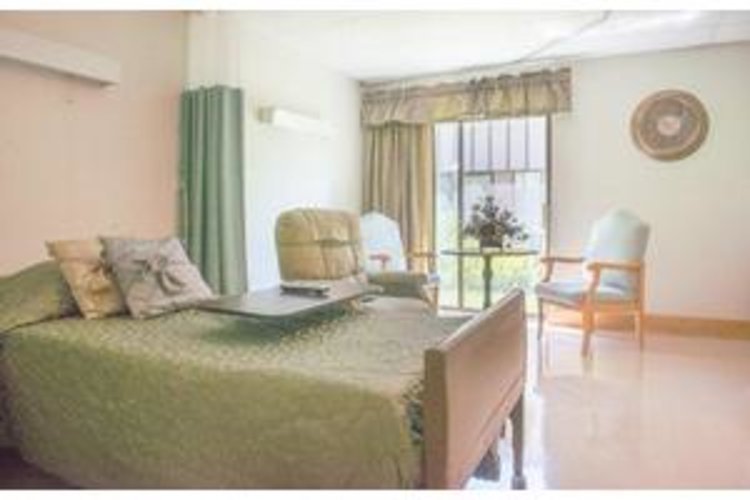
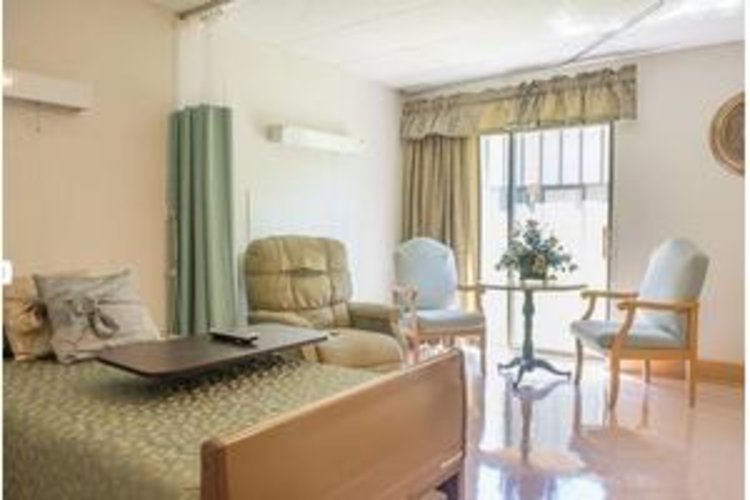
Candlewood Valley Health & Rehabilitation Center offers short-term care, long-term care, memory care and specialty nursing. The trained staff includes experienced therapists who provide comprehensive therapy plans for residents with conditions such as MS and Parkinson’s disease. Services available include podiatry, optometry and dental care. There are private rooms available. …. SHOW MORE
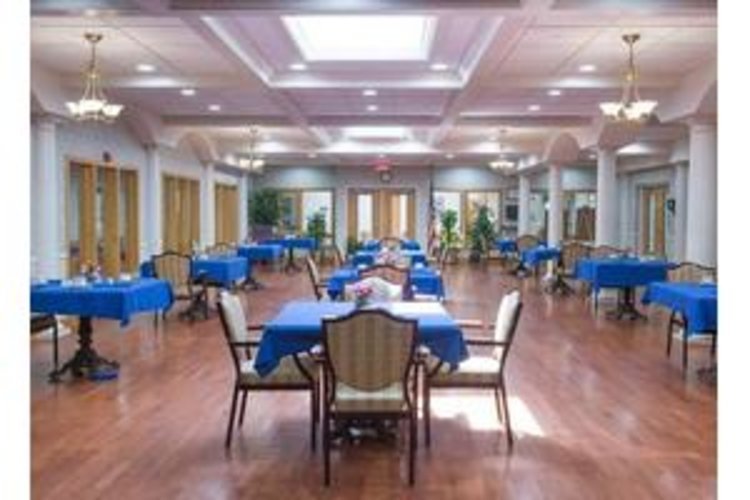
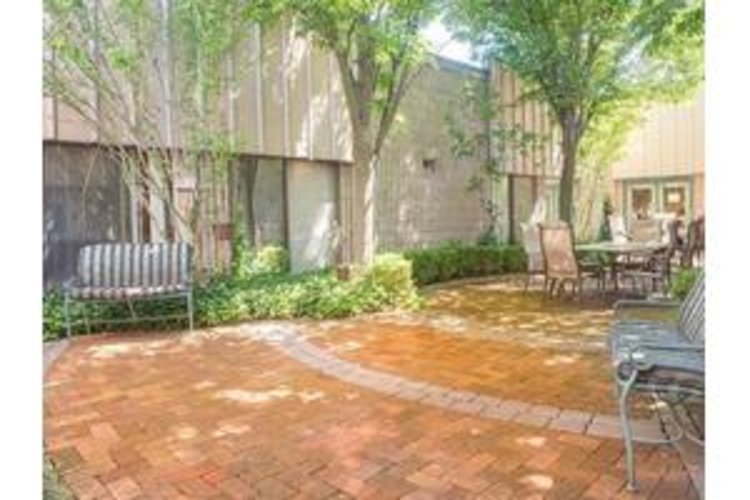
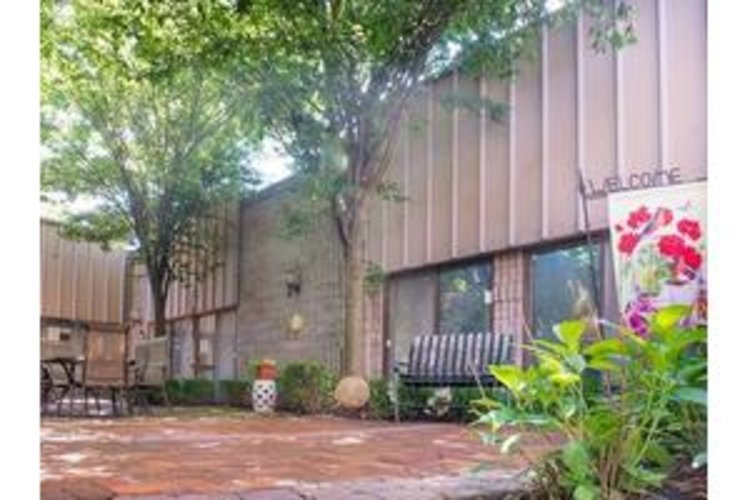
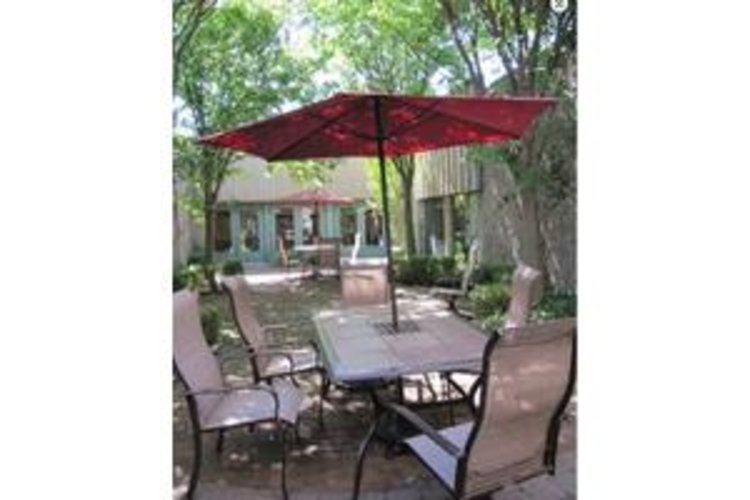
Residents at Candlewood Valley have access to a wide range of amenities, including an updated therapy gym, an internet cafe and family lounges. The community has an outdoor patio area for residents to relax with friends and visiting loved ones. Residents can get involved in daily enriching activities, such as exercise classes and brain games.;
SHOW LESSContact for available floor plans
Contact for available Payment Options
Neighborhood & Demographics
DEMOGRAPHIC BREAKDOWN
35%
Single
Marital Status
47%
Married Couples
Community
79%
Drove By Themselves
Commute
4%
Below 9th Grade
Highest Level of Education
26%
Children
Adult vs. Children
11%
0-9
Population by Age
11%
0-9
Males by Age Distribution
10%
0-9
Females by Age Distribution
Males by Age Distribution
Status | Percentage |
---|---|
0-9 | 11% |
10-19 | 13% |
20-29 | 13% |
30-39 | 12% |
40-49 | 12% |
50-59 | 14% |
60-69 | 10% |
70-79 | 12% |
80 Above | 3% |
Females by Age Distribution
Status | Percentage |
---|---|
0-9 | 10% |
10-19 | 12% |
20-29 | 12% |
30-39 | 11% |
40-49 | 13% |
50-59 | 15% |
60-69 | 11% |
70-79 | 12% |
80 Above | 5% |
Marital Status
Status | Percentage |
---|---|
Single | 35% |
Married (Not Separated) | 47% |
Separated | 1% |
Widowed | 6% |
Divorced | 11% |
Community
Status | Percentage |
---|---|
Married Couples | 47% |
Single Females | 12% |
Single Males | 4% |
Living Alone | 11% |
Living With Family | 26% |
Commute
Status | Percentage |
---|---|
Drove By Themselves | 79% |
Public Transportation | 5% |
Carpooled | 8% |
Walked | 3% |
Occasional Drive | 0% |
Work At Home | 4% |
Other | 1% |
Highest Level of Education
Status | Percentage |
---|---|
Below 9th Grade | 4% |
Bachelors Degree | 21% |
High School | 28% |
College | 18% |
Associate Degree | 7% |
9th to 12th Grade | 6% |
Graduate | 16% |
Adult vs. Children
Status | Percentage |
---|---|
Children | 26% |
Adult | 74% |
Population by Age
Status | Percentage |
---|---|
0-9 | 11% |
10-19 | 14% |
20-29 | 12% |
30-39 | 12% |
40-49 | 13% |
50-59 | 15% |
60-69 | 11% |
70-79 | 6% |
80 Above | 4% |
Males by Age Distribution
Status | Percentage |
---|---|
0-9 | 11% |
10-19 | 13% |
20-29 | 13% |
30-39 | 12% |
40-49 | 12% |
50-59 | 14% |
60-69 | 10% |
70-79 | 12% |
80 Above | 3% |
Females by Age Distribution
Status | Percentage |
---|---|
0-9 | 10% |
10-19 | 12% |
20-29 | 12% |
30-39 | 11% |
40-49 | 13% |
50-59 | 15% |
60-69 | 11% |
70-79 | 12% |
80 Above | 5% |