36.5571
-82.1878
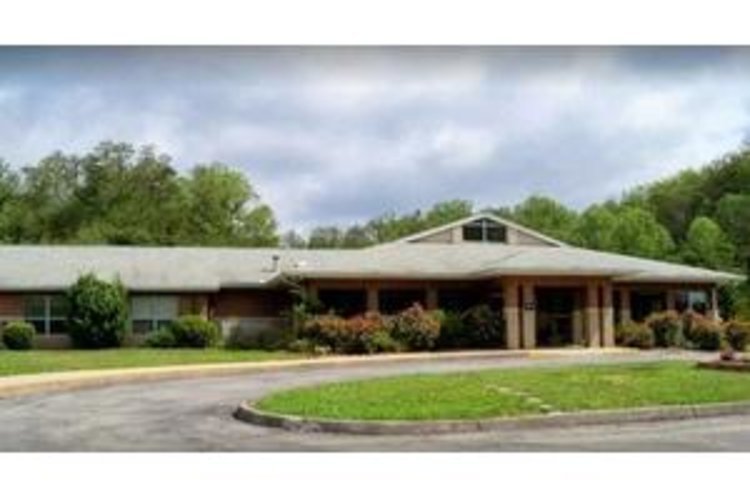
The Cambridge House
$ Call for Rates
250 BELLEBROOK RD, Bristol, TN 37620
$ Call for Rates
250 BELLEBROOK RD, Bristol, TN 37620
Care Types: Nursing Care, Assisted Living
The Cambridge House is located in the predominantly middle-class area of Bristol, Tennessee. The densely populated district is home to shops, restaurants, health care services and several places of worship. Multiple drugstores are within a mile of the facility, and the Rehabilitation Hospital of Bristol is just 15 minutes away.
The Cambridge House offers nursing home care for those requiring around-the-clock assistance and a high level of attention from a team of professional nursing staff. Support is available with activities of daily living, including bathing, dressing, toileting and medication support. Additional medical services include dental care, occupational therapy, hearing care and podiatry. …. SHOW MORE
Housekeeping and maintenance services ensure chore-free living, and central air conditioning offers year-round comfort. Fully furnished accommodations are available, and an emergency call system quickly alerts staff members to any issues. Physically, mentally and spiritually stimulating activities include religious activities and daily exercise to help improve strength and balance. Residents can grab a box of popcorn and get together with friends for a movie night, or take part in one of the education programs to learn something new.
SHOW LESS
30%
Single
Marital Status
47%
Married Couples
Community
84%
Drove By Themselves
Commute
6%
Below 9th Grade
Highest Level of Education
27%
Children
Adult vs. Children
12%
0-9
Population by Age
12%
0-9
Males by Age Distribution
11%
0-9
Females by Age Distribution
| Status | Percentage |
|---|---|
| 0-9 | 12% |
| 10-19 | 13% |
| 20-29 | 13% |
| 30-39 | 12% |
| 40-49 | 12% |
| 50-59 | 13% |
| 60-69 | 10% |
| 70-79 | 12% |
| 80 Above | 2% |
| Status | Percentage |
|---|---|
| 0-9 | 11% |
| 10-19 | 12% |
| 20-29 | 13% |
| 30-39 | 12% |
| 40-49 | 12% |
| 50-59 | 13% |
| 60-69 | 11% |
| 70-79 | 12% |
| 80 Above | 4% |
| Status | Percentage |
|---|---|
| Single | 30% |
| Married (Not Separated) | 48% |
| Separated | 2% |
| Widowed | 6% |
| Divorced | 13% |
| Status | Percentage |
|---|---|
| Married Couples | 47% |
| Single Females | 13% |
| Single Males | 4% |
| Living Alone | 10% |
| Living With Family | 25% |
| Status | Percentage |
|---|---|
| Drove By Themselves | 84% |
| Public Transportation | 1% |
| Carpooled | 9% |
| Walked | 1% |
| Occasional Drive | 0% |
| Work At Home | 4% |
| Other | 1% |
| Status | Percentage |
|---|---|
| Below 9th Grade | 6% |
| Bachelors Degree | 16% |
| High School | 33% |
| College | 21% |
| Associate Degree | 6% |
| 9th to 12th Grade | 9% |
| Graduate | 9% |
| Status | Percentage |
|---|---|
| Children | 27% |
| Adult | 73% |
| Status | Percentage |
|---|---|
| 0-9 | 12% |
| 10-19 | 14% |
| 20-29 | 13% |
| 30-39 | 13% |
| 40-49 | 13% |
| 50-59 | 14% |
| 60-69 | 11% |
| 70-79 | 6% |
| 80 Above | 4% |
| Status | Percentage |
|---|---|
| 0-9 | 12% |
| 10-19 | 13% |
| 20-29 | 13% |
| 30-39 | 12% |
| 40-49 | 12% |
| 50-59 | 13% |
| 60-69 | 10% |
| 70-79 | 12% |
| 80 Above | 2% |
| Status | Percentage |
|---|---|
| 0-9 | 11% |
| 10-19 | 12% |
| 20-29 | 13% |
| 30-39 | 12% |
| 40-49 | 12% |
| 50-59 | 13% |
| 60-69 | 11% |
| 70-79 | 12% |
| 80 Above | 4% |
By clicking “Request Info” you agree to our Terms of Use and Privacy Policy. You also consent to receive texts and calls, which may be autodialed, from us and our partner providers; however, your consent is not a condition to using our service.

By clicking “Request Info”, you agree to our Terms of Use, our Privacy Policy, and our Agreement to be Contacted by Telephone. You also consent that we, or our partner providers, may reach out to you about senior living solutions or Medicare insurance using a system that can auto-dial; however, you do not need to consent to this to use our service.