Burlington Health & Rehab
$ Call for Rates
300 Pearl Street, Burlington, VT 05401
Overview
Care Types: Nursing Care, Assisted Living
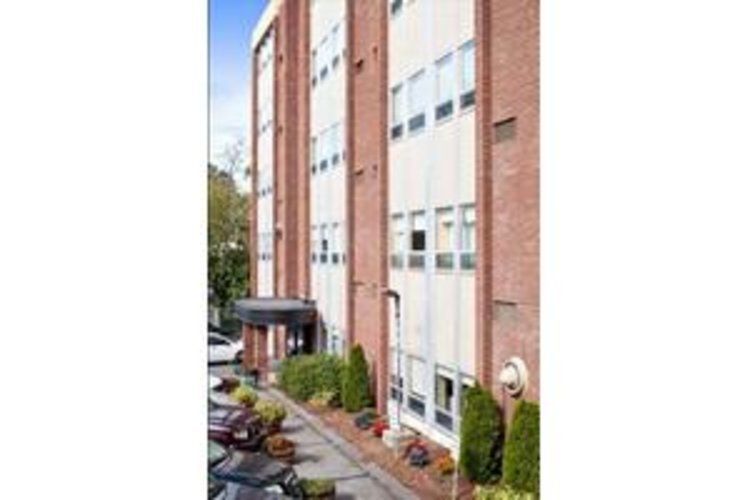
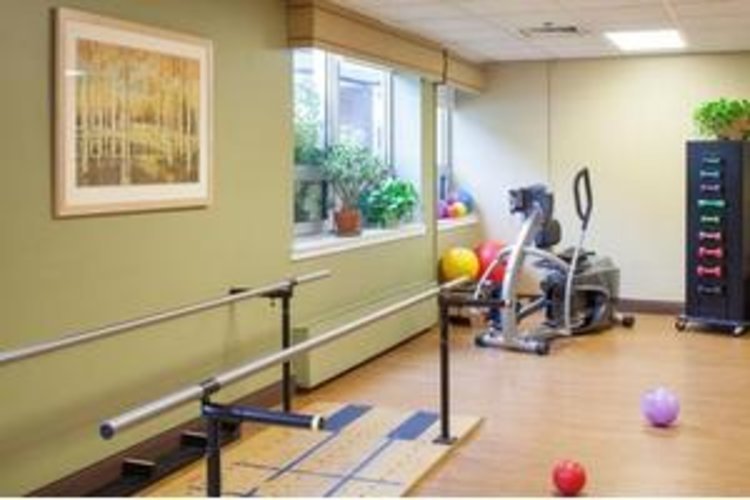
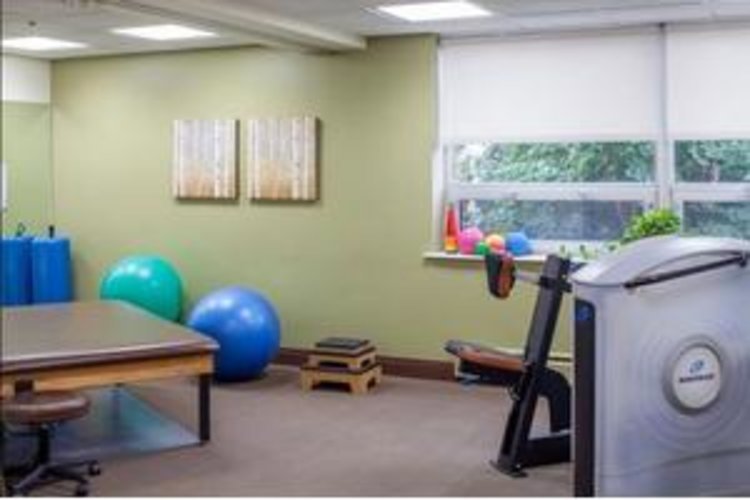
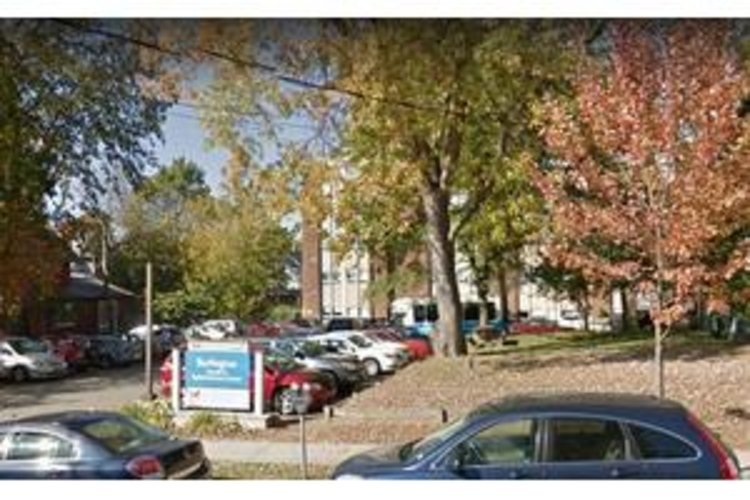
Burlington Health & Rehab located in Burlington, Vermont, provides a soothing community for seniors to receive care and rehabilitation. The area is home to many shops, restaurants, points of interest and medical centers, all of which are within easy reach. Good transport links enable easy visitation from family and friends.
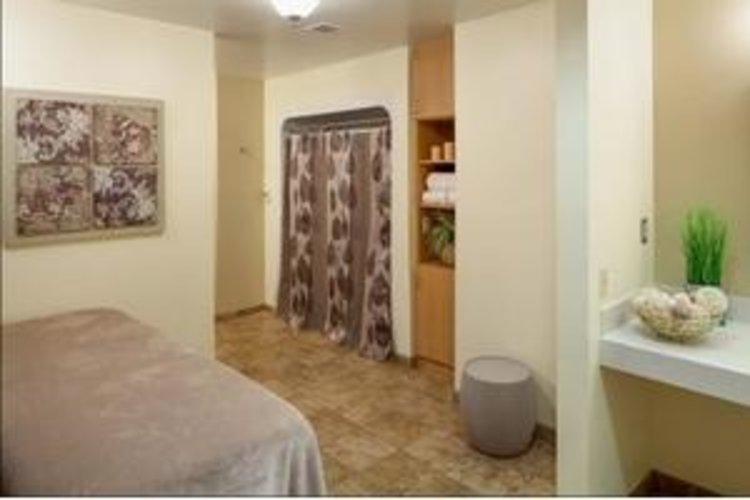
Seniors received personalized care at Burlington Health & Rehab, and caregivers, who are available 24 hours a day, are on hand to assist with activities of daily living such as dressing, bathing and medication management. Seniors also benefit from a mental wellness program. Caregivers also coordinate with external health care providers, to ensure that a full spectrum of high-quality care is provided, and transportation for medical purposes is arranged by the community. …. SHOW MORE
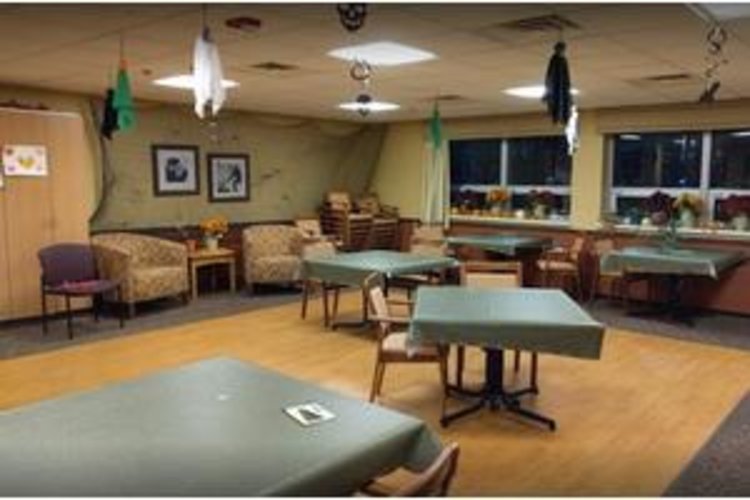
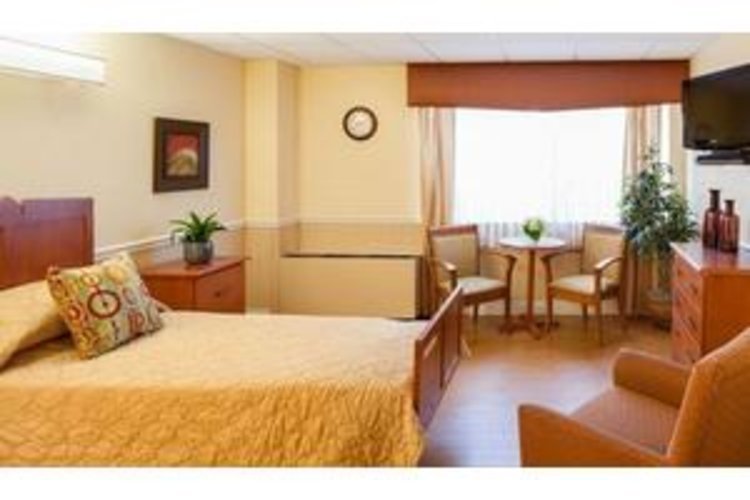
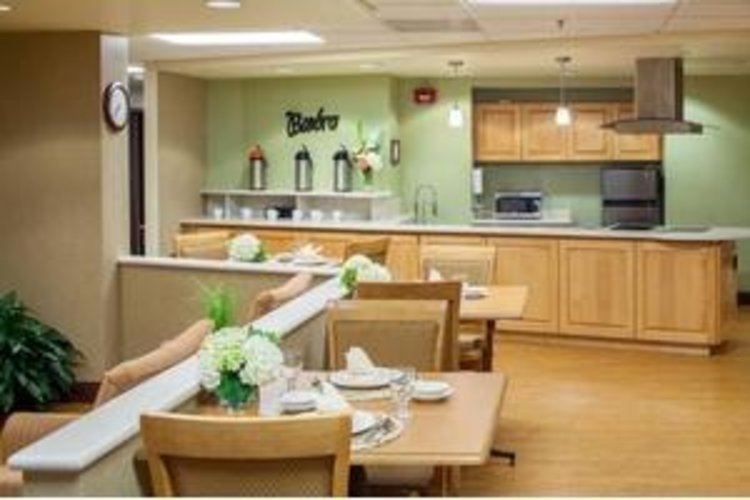
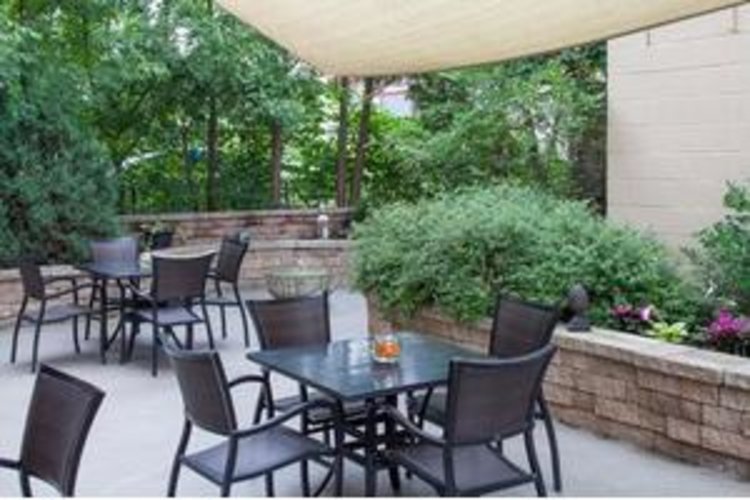
Residents can take part in group activities that are meaningful and enriching to their lives. Seniors can have their meals prepared, or dine in their own private room if they wish. Housekeeping and laundry are taken care of, allowing seniors more time for enjoyment and recuperation. Each room includes cable, Wi-Fi, a kitchenette and a telephone, and the community includes a shared dining room, beauty salon, and outdoor space.
SHOW LESSContact for available floor plans
Contact for available Payment Options
DEMOGRAPHIC BREAKDOWN
32%
Single
Marital Status
49%
Married Couples
Community
75%
Drove By Themselves
Commute
3%
Below 9th Grade
Highest Level of Education
24%
Children
Adult vs. Children
10%
0-9
Population by Age
10%
0-9
Males by Age Distribution
9%
0-9
Females by Age Distribution
Males by Age Distribution
Status | Percentage |
---|---|
0-9 | 10% |
10-19 | 13% |
20-29 | 12% |
30-39 | 11% |
40-49 | 11% |
50-59 | 14% |
60-69 | 13% |
70-79 | 13% |
80 Above | 3% |
Females by Age Distribution
Status | Percentage |
---|---|
0-9 | 9% |
10-19 | 11% |
20-29 | 12% |
30-39 | 11% |
40-49 | 11% |
50-59 | 15% |
60-69 | 13% |
70-79 | 12% |
80 Above | 5% |
Marital Status
Status | Percentage |
---|---|
Single | 32% |
Married (Not Separated) | 49% |
Separated | 1% |
Widowed | 6% |
Divorced | 13% |
Community
Status | Percentage |
---|---|
Married Couples | 49% |
Single Females | 9% |
Single Males | 4% |
Living Alone | 11% |
Living With Family | 27% |
Commute
Status | Percentage |
---|---|
Drove By Themselves | 75% |
Public Transportation | 1% |
Carpooled | 10% |
Walked | 6% |
Occasional Drive | 0% |
Work At Home | 7% |
Other | 2% |
Highest Level of Education
Status | Percentage |
---|---|
Below 9th Grade | 3% |
Bachelors Degree | 21% |
High School | 31% |
College | 17% |
Associate Degree | 8% |
9th to 12th Grade | 5% |
Graduate | 14% |
Adult vs. Children
Status | Percentage |
---|---|
Children | 24% |
Adult | 76% |
Population by Age
Status | Percentage |
---|---|
0-9 | 10% |
10-19 | 14% |
20-29 | 12% |
30-39 | 12% |
40-49 | 12% |
50-59 | 16% |
60-69 | 14% |
70-79 | 7% |
80 Above | 5% |
Males by Age Distribution
Status | Percentage |
---|---|
0-9 | 10% |
10-19 | 13% |
20-29 | 12% |
30-39 | 11% |
40-49 | 11% |
50-59 | 14% |
60-69 | 13% |
70-79 | 13% |
80 Above | 3% |
Females by Age Distribution
Status | Percentage |
---|---|
0-9 | 9% |
10-19 | 11% |
20-29 | 12% |
30-39 | 11% |
40-49 | 11% |
50-59 | 15% |
60-69 | 13% |
70-79 | 12% |
80 Above | 5% |