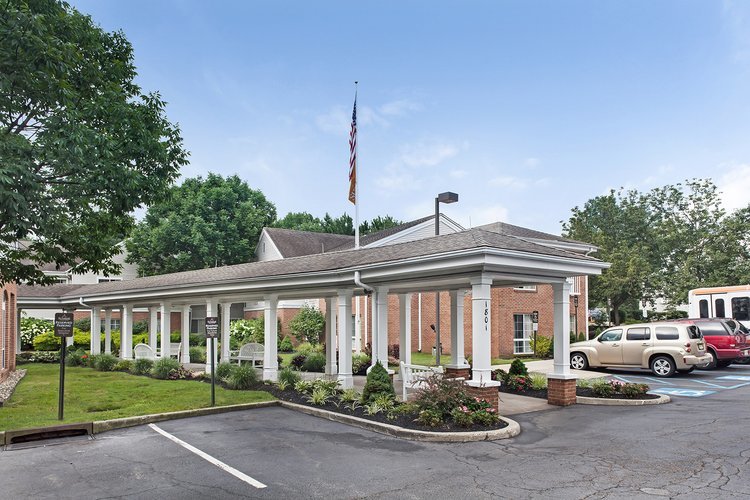
Brighton Gardens of Edison
$ Call for Rates
1801 Oak Tree Road, Edison, NJ 08820
Overview
Care Types: Assisted Living, Alzheimer’s Care
We sub acute rehab, assisted living and Memory Care. Offer Medicaid after 2 years of private pay. Accept hoyer lifts, 2 person transfer, sliding board transfer, oxygen, colostomy bag and insulin.
….
SHOW MORE
To learn more about this provider’s license and review other available state reports, please visit:
State of New Jersey Department of Health Long-Term Care Facility Search
Amenities
- Hindi Language
- English Language
- Free Transportation Services
- Housekeeping Services Available
- In-house Laundry and Drycleaning
- In-House Religious Services
- In-house Skilled Nursing
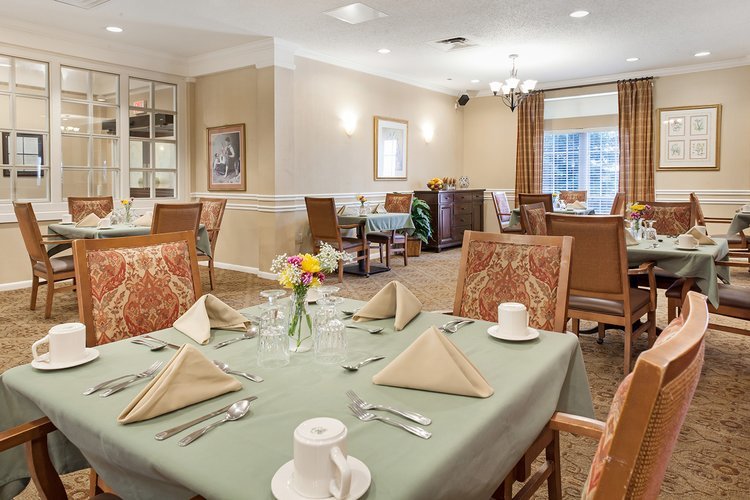
- Community Dining Available
- Medication Administration
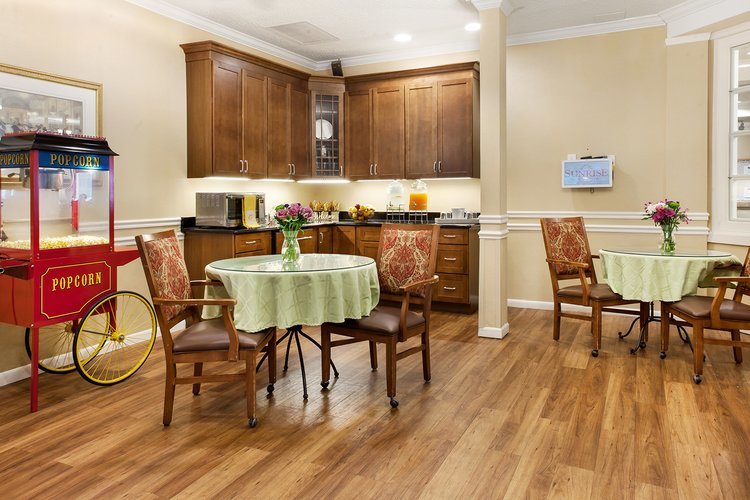
- Offsite Activities Available
- On-site haircuts/barber services
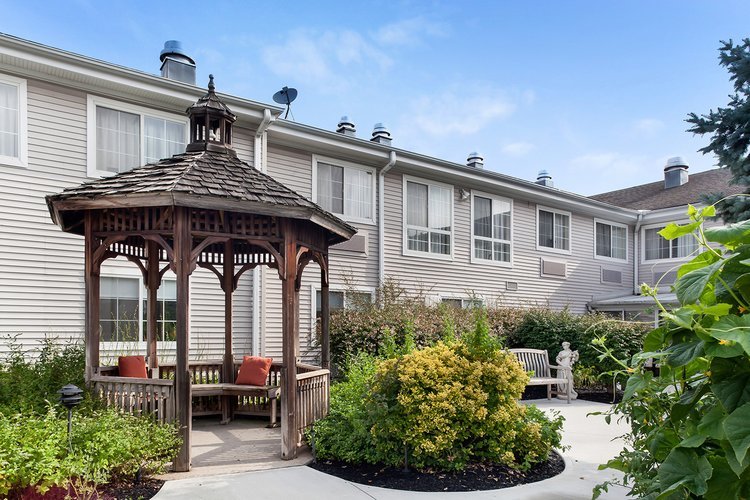
- Outdoor Patios and Gardens
- Physical Therapist Services
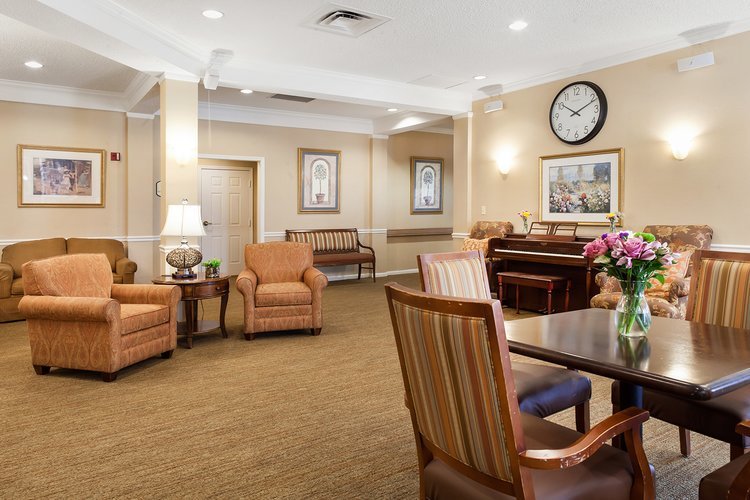
- Recreation room
- Licensed by the State
- Skilled nursing services
Contact for available floor plans
Contact for available Payment Options
Neighborhood & Demographics

DEMOGRAPHIC BREAKDOWN
35%
Single
Marital Status
47%
Married Couples
Community
72%
Drove By Themselves
Commute
5%
Below 9th Grade
Highest Level of Education
26%
Children
Adult vs. Children
12%
0-9
Population by Age
12%
0-9
Males by Age Distribution
11%
0-9
Females by Age Distribution
Males by Age Distribution
| Status | Percentage |
|---|---|
| 0-9 | 12% |
| 10-19 | 13% |
| 20-29 | 13% |
| 30-39 | 12% |
| 40-49 | 13% |
| 50-59 | 14% |
| 60-69 | 10% |
| 70-79 | 11% |
| 80 Above | 3% |
Females by Age Distribution
| Status | Percentage |
|---|---|
| 0-9 | 11% |
| 10-19 | 12% |
| 20-29 | 12% |
| 30-39 | 12% |
| 40-49 | 13% |
| 50-59 | 14% |
| 60-69 | 11% |
| 70-79 | 11% |
| 80 Above | 5% |
Marital Status
| Status | Percentage |
|---|---|
| Single | 35% |
| Married (Not Separated) | 49% |
| Separated | 2% |
| Widowed | 6% |
| Divorced | 9% |
Community
| Status | Percentage |
|---|---|
| Married Couples | 47% |
| Single Females | 13% |
| Single Males | 4% |
| Living Alone | 10% |
| Living With Family | 26% |
Commute
| Status | Percentage |
|---|---|
| Drove By Themselves | 72% |
| Public Transportation | 11% |
| Carpooled | 8% |
| Walked | 3% |
| Occasional Drive | 0% |
| Work At Home | 4% |
| Other | 2% |
Highest Level of Education
| Status | Percentage |
|---|---|
| Below 9th Grade | 5% |
| Bachelors Degree | 23% |
| High School | 29% |
| College | 17% |
| Associate Degree | 6% |
| 9th to 12th Grade | 6% |
| Graduate | 14% |
Adult vs. Children
| Status | Percentage |
|---|---|
| Children | 26% |
| Adult | 74% |
Population by Age
| Status | Percentage |
|---|---|
| 0-9 | 12% |
| 10-19 | 13% |
| 20-29 | 12% |
| 30-39 | 13% |
| 40-49 | 14% |
| 50-59 | 15% |
| 60-69 | 11% |
| 70-79 | 6% |
| 80 Above | 4% |
Males by Age Distribution
| Status | Percentage |
|---|---|
| 0-9 | 12% |
| 10-19 | 13% |
| 20-29 | 13% |
| 30-39 | 12% |
| 40-49 | 13% |
| 50-59 | 14% |
| 60-69 | 10% |
| 70-79 | 11% |
| 80 Above | 3% |
Females by Age Distribution
| Status | Percentage |
|---|---|
| 0-9 | 11% |
| 10-19 | 12% |
| 20-29 | 12% |
| 30-39 | 12% |
| 40-49 | 13% |
| 50-59 | 14% |
| 60-69 | 11% |
| 70-79 | 11% |
| 80 Above | 5% |
