
41.9494
-87.9355
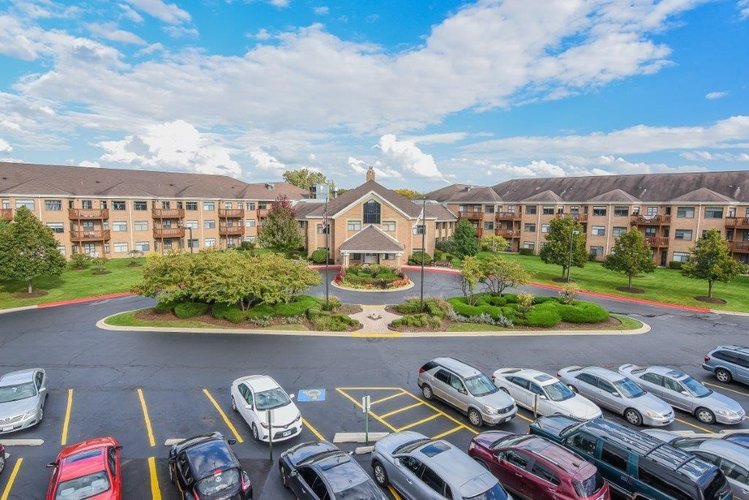
Bridgeway of Bensenville
$ Call for Rates
303 E Washington Street, Bensenville, IL 60106
Amenities
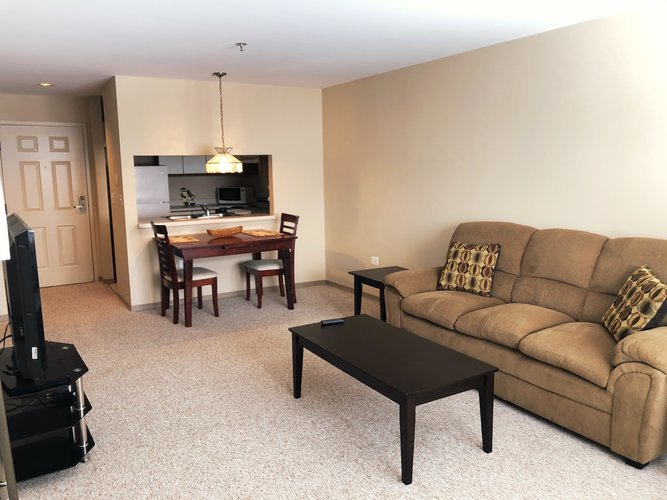
- 2-bedroom apartments
- Adults 55 and over accepted
- All-inclusive pricing structure
- Three-bedroom units
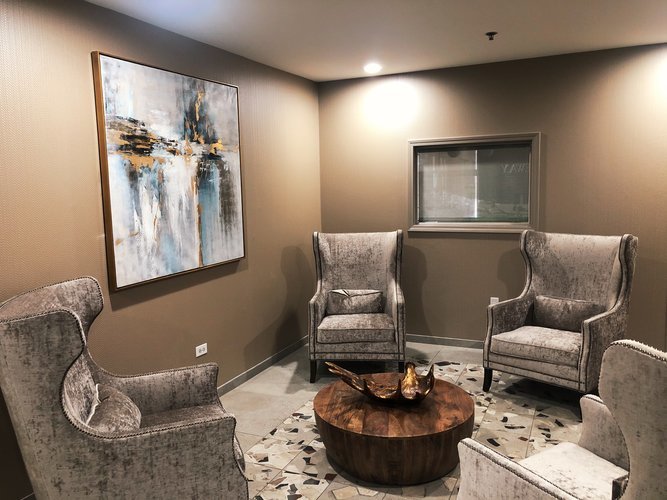
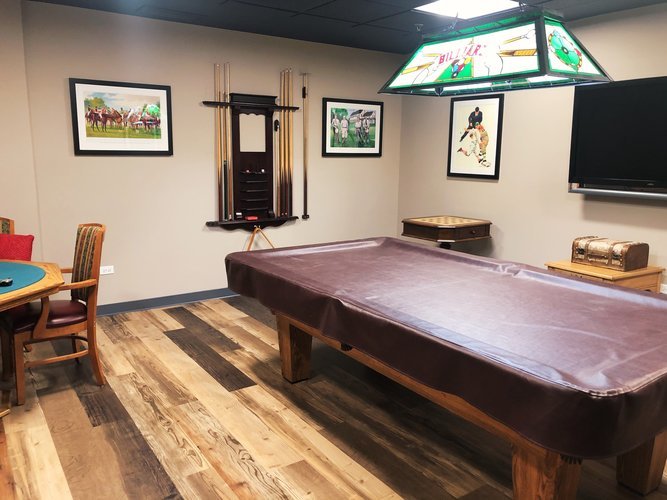
- Common Areas with TVs
- Free High-Speed WiFi access
- Free Transportation Services
- Full-size kitchen
- Grounds Secured
- Housekeeping Services Available
- Entry Fee Required
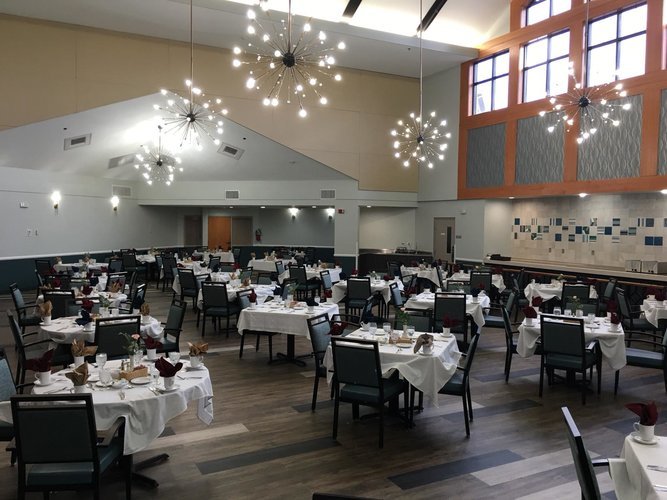
- Community Dining Available
- On-site haircuts/barber services
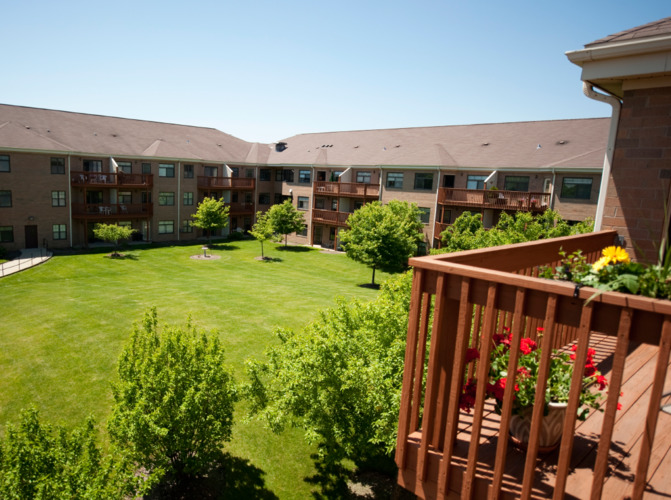
- Outdoor Patios and Gardens
- Respite Care Available
- Licensed by the State
- Semi-Private Apartments/Rooms
- Single Room Units Available
- Some Pets Are Allowed
- Standalone cottages/bungalows
- Studio Apartments Available

