Bradford Village Association
$ Call for Rates
P.O Box 275, Santee, SC 29142
Overview
Care Types: Independent Living, Retirement
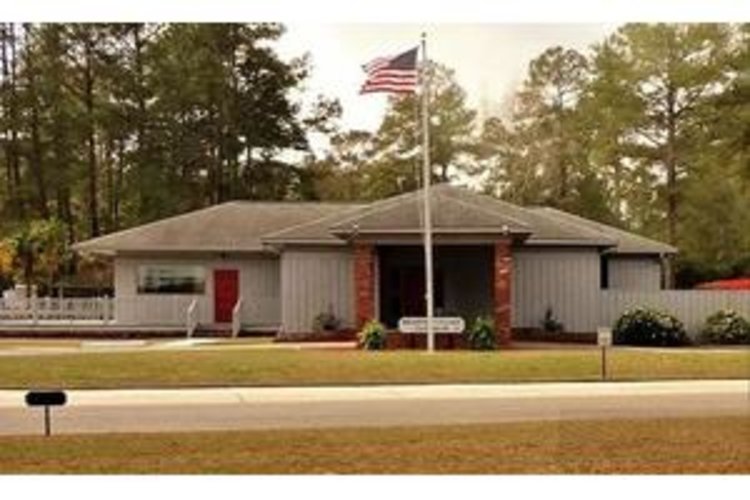
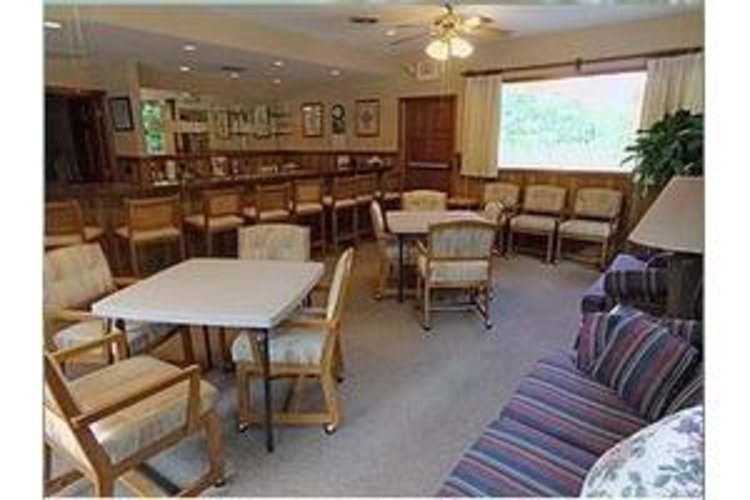
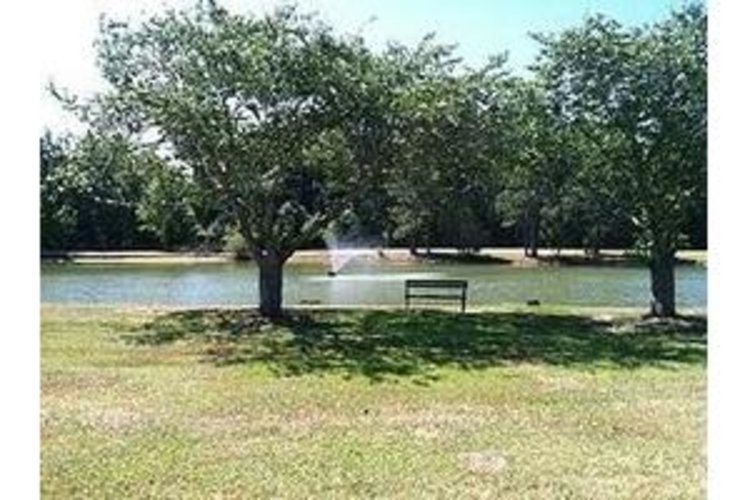
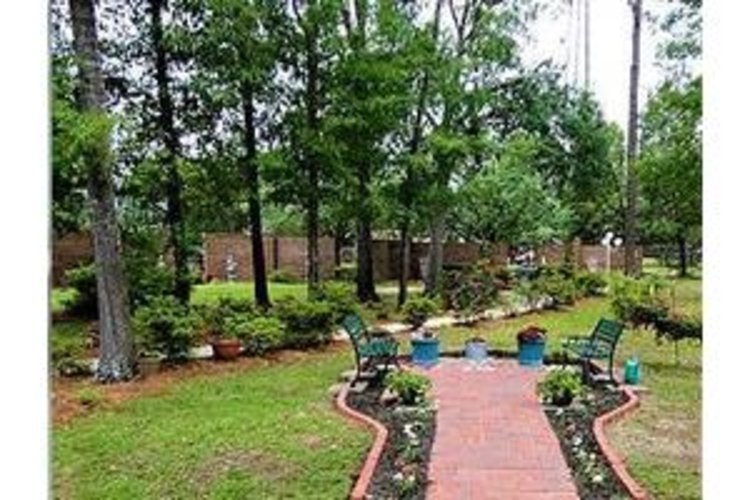
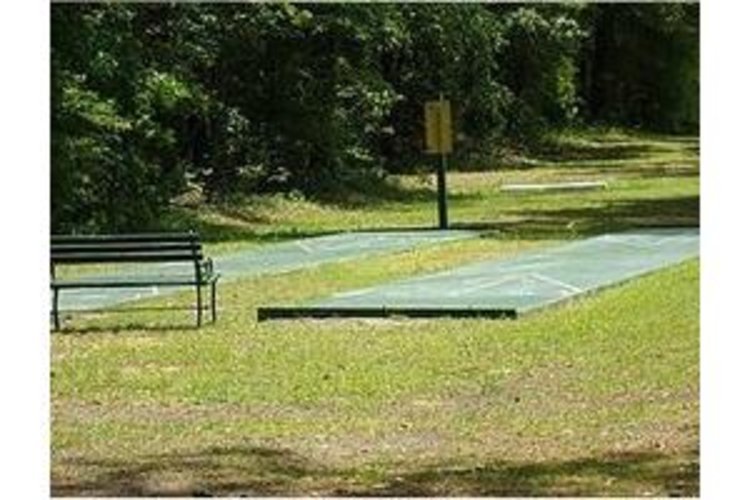
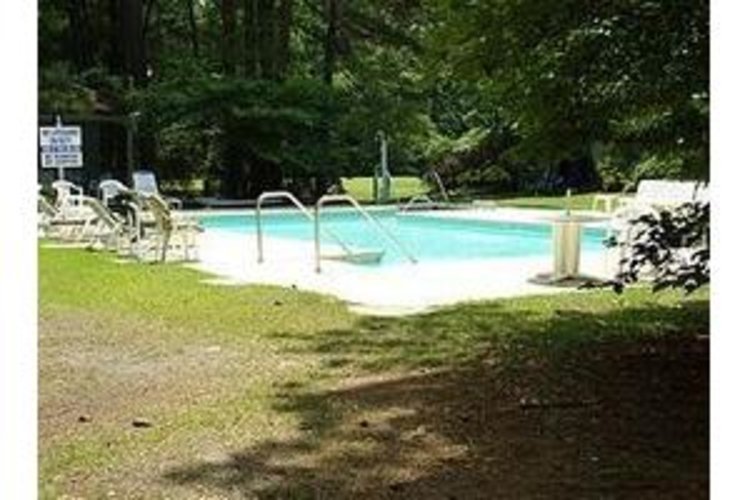
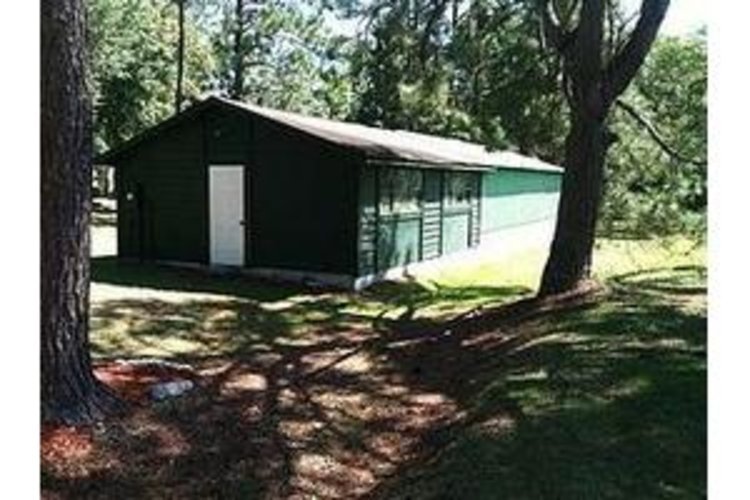
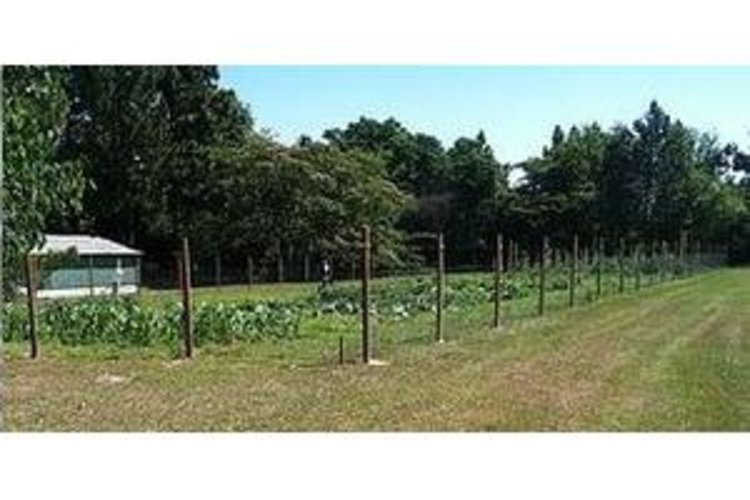
Bradford Village Association is located inSantee, SC, which enjoys a temperate climate year-round. The community is located near shopping, restaurants, and a large state park, which makes it ideal for active seniors Doctors and pharmacies are both within walking distance. Those with major medical concerns can benefit from two major hospitals nearby.
Contact for available floor plans
Contact for available Payment Options
DEMOGRAPHIC BREAKDOWN
33%
Single
Marital Status
45%
Married Couples
Community
83%
Drove By Themselves
Commute
5%
Below 9th Grade
Highest Level of Education
27%
Children
Adult vs. Children
12%
0-9
Population by Age
12%
0-9
Males by Age Distribution
11%
0-9
Females by Age Distribution
Males by Age Distribution
Status | Percentage |
---|---|
0-9 | 12% |
10-19 | 13% |
20-29 | 13% |
30-39 | 11% |
40-49 | 12% |
50-59 | 12% |
60-69 | 11% |
70-79 | 13% |
80 Above | 2% |
Females by Age Distribution
Status | Percentage |
---|---|
0-9 | 11% |
10-19 | 11% |
20-29 | 12% |
30-39 | 11% |
40-49 | 12% |
50-59 | 13% |
60-69 | 12% |
70-79 | 13% |
80 Above | 4% |
Marital Status
Status | Percentage |
---|---|
Single | 33% |
Married (Not Separated) | 47% |
Separated | 3% |
Widowed | 7% |
Divorced | 11% |
Community
Status | Percentage |
---|---|
Married Couples | 45% |
Single Females | 15% |
Single Males | 4% |
Living Alone | 10% |
Living With Family | 26% |
Commute
Status | Percentage |
---|---|
Drove By Themselves | 83% |
Public Transportation | 1% |
Carpooled | 9% |
Walked | 2% |
Occasional Drive | 0% |
Work At Home | 4% |
Other | 2% |
Highest Level of Education
Status | Percentage |
---|---|
Below 9th Grade | 5% |
Bachelors Degree | 16% |
High School | 30% |
College | 21% |
Associate Degree | 9% |
9th to 12th Grade | 10% |
Graduate | 9% |
Adult vs. Children
Status | Percentage |
---|---|
Children | 27% |
Adult | 73% |
Population by Age
Status | Percentage |
---|---|
0-9 | 12% |
10-19 | 14% |
20-29 | 13% |
30-39 | 12% |
40-49 | 13% |
50-59 | 14% |
60-69 | 12% |
70-79 | 7% |
80 Above | 4% |
Males by Age Distribution
Status | Percentage |
---|---|
0-9 | 12% |
10-19 | 13% |
20-29 | 13% |
30-39 | 11% |
40-49 | 12% |
50-59 | 12% |
60-69 | 11% |
70-79 | 13% |
80 Above | 2% |
Females by Age Distribution
Status | Percentage |
---|---|
0-9 | 11% |
10-19 | 11% |
20-29 | 12% |
30-39 | 11% |
40-49 | 12% |
50-59 | 13% |
60-69 | 12% |
70-79 | 13% |
80 Above | 4% |