41.2786
-95.8365
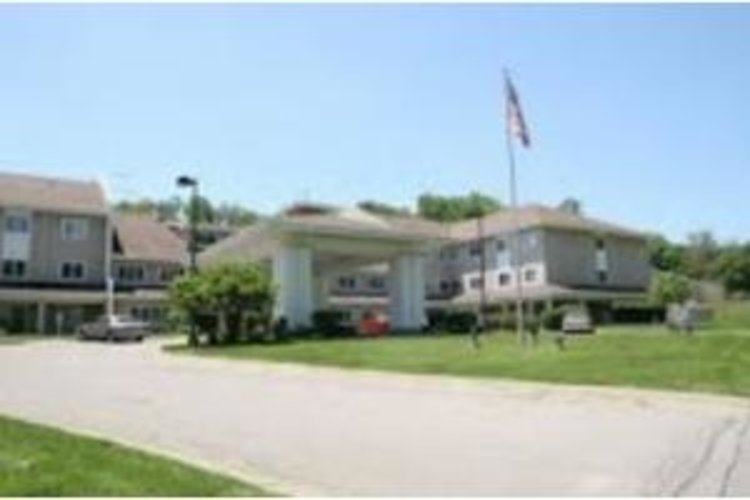
Bethany Lutheran Home
$ Call for Rates
7 Elliott St, Council Bluffs, IA 51503
$ Call for Rates
7 Elliott St, Council Bluffs, IA 51503
Care Types: Nursing Care, Assisted Living, Memory Care
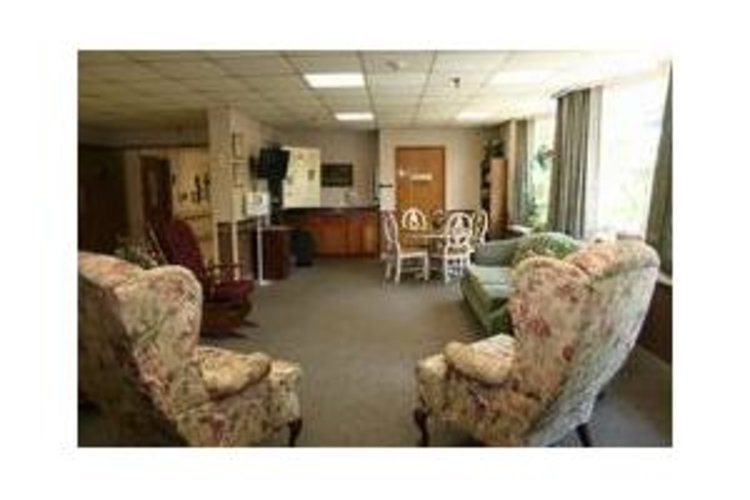
Welcome to Bethany Lutheran Home! Sponsored by Bethany Lutheran Home, Bethany Heights Assisted Living offers assisted living apartment homes and additional services to meet your individual needs. You can expect the same level of quality, value, and care at Bethany Heights that other area seniors have been enjoying with us for many years. Bethany Heights is a nonprofit organization, and seniors of all faiths are welcome.

30%
Single
Marital Status
50%
Married Couples
Community
80%
Drove By Themselves
Commute
3%
Below 9th Grade
Highest Level of Education
28%
Children
Adult vs. Children
13%
0-9
Population by Age
12%
0-9
Males by Age Distribution
12%
0-9
Females by Age Distribution
| Status | Percentage |
|---|---|
| 0-9 | 12% |
| 10-19 | 13% |
| 20-29 | 13% |
| 30-39 | 12% |
| 40-49 | 11% |
| 50-59 | 13% |
| 60-69 | 11% |
| 70-79 | 12% |
| 80 Above | 3% |
| Status | Percentage |
|---|---|
| 0-9 | 12% |
| 10-19 | 12% |
| 20-29 | 12% |
| 30-39 | 12% |
| 40-49 | 11% |
| 50-59 | 13% |
| 60-69 | 11% |
| 70-79 | 12% |
| 80 Above | 6% |
| Status | Percentage |
|---|---|
| Single | 30% |
| Married (Not Separated) | 52% |
| Separated | 1% |
| Widowed | 6% |
| Divorced | 11% |
| Status | Percentage |
|---|---|
| Married Couples | 50% |
| Single Females | 9% |
| Single Males | 4% |
| Living Alone | 11% |
| Living With Family | 26% |
| Status | Percentage |
|---|---|
| Drove By Themselves | 80% |
| Public Transportation | 1% |
| Carpooled | 9% |
| Walked | 4% |
| Occasional Drive | 0% |
| Work At Home | 5% |
| Other | 2% |
| Status | Percentage |
|---|---|
| Below 9th Grade | 3% |
| Bachelors Degree | 18% |
| High School | 33% |
| College | 22% |
| Associate Degree | 11% |
| 9th to 12th Grade | 5% |
| Graduate | 8% |
| Status | Percentage |
|---|---|
| Children | 28% |
| Adult | 72% |
| Status | Percentage |
|---|---|
| 0-9 | 13% |
| 10-19 | 14% |
| 20-29 | 13% |
| 30-39 | 12% |
| 40-49 | 12% |
| 50-59 | 14% |
| 60-69 | 11% |
| 70-79 | 6% |
| 80 Above | 5% |
| Status | Percentage |
|---|---|
| 0-9 | 12% |
| 10-19 | 13% |
| 20-29 | 13% |
| 30-39 | 12% |
| 40-49 | 11% |
| 50-59 | 13% |
| 60-69 | 11% |
| 70-79 | 12% |
| 80 Above | 3% |
| Status | Percentage |
|---|---|
| 0-9 | 12% |
| 10-19 | 12% |
| 20-29 | 12% |
| 30-39 | 12% |
| 40-49 | 11% |
| 50-59 | 13% |
| 60-69 | 11% |
| 70-79 | 12% |
| 80 Above | 6% |
By clicking “Request Info” you agree to our Terms of Use and Privacy Policy. You also consent to receive texts and calls, which may be autodialed, from us and our partner providers; however, your consent is not a condition to using our service.

By clicking “Request Info”, you agree to our Terms of Use, our Privacy Policy, and our Agreement to be Contacted by Telephone. You also consent that we, or our partner providers, may reach out to you about senior living solutions or Medicare insurance using a system that can auto-dial; however, you do not need to consent to this to use our service.