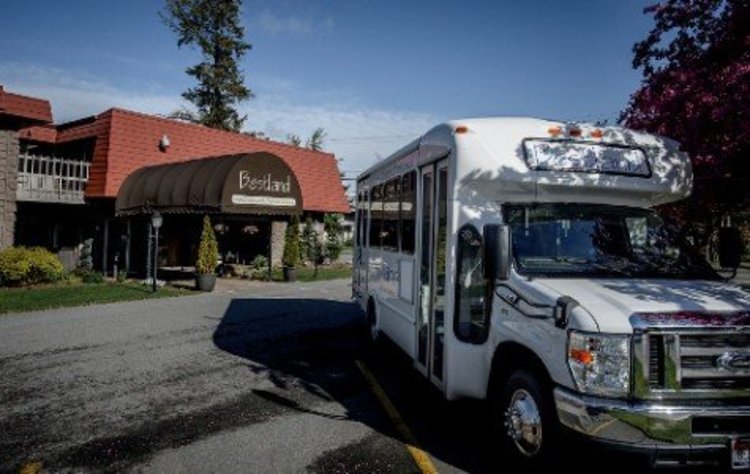
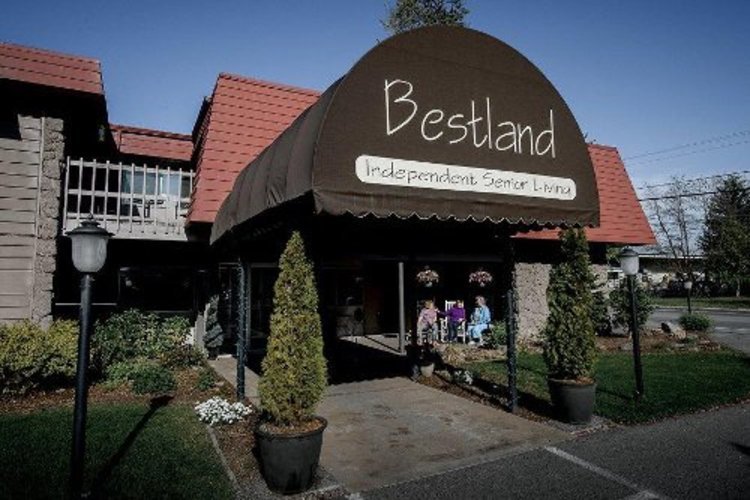
Bestland Senior Living Community
Area’s Most Affordable Retirement Community
At Bestland Senior Living Community our resident’s needs and comfort come first. In your monthly apartment-home rental these amenities are included:
- State-of-the-art fitness center with weekly exercise programs
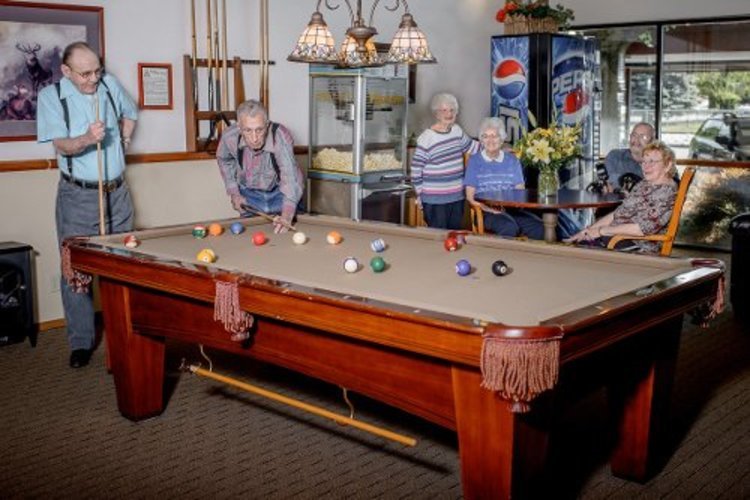
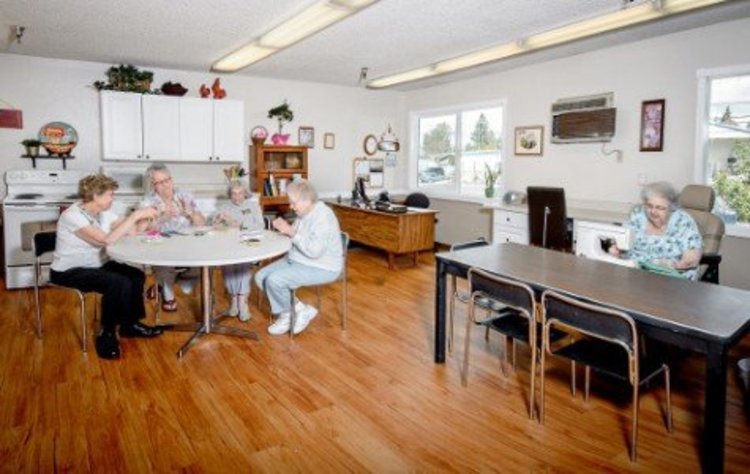
- Creative, social and wellness programs
- Beauty salon, general store, and private dining room
- Weekly housekeeping and linen services
- Expanded cable TV service
- All utilities, except telephone
- Convenient, no-cost laundry facilities
- Apartment-home maintenance services
- 24-hour emergency and security personnel
- Scheduled transportation to stores, doctors and more
- Guided cultural and recreational outings
- Personal shopping service: you provide your list and funds each Wednesday and we do the rest.
- Resident parking (Covered carports available at nominal fee)
- Pet Friendly!!
We offer 78 spacious one and two-bedroom private apartment-homes, many with full kitchens or kitchenettes and private balconies or patios. And, your new home rental includes meals, and, there’s no purchase or buy-in necessary.
….
SHOW MORE
Bestland Senior Living Community apartment-homes have flexible leasing terms including month-to-month.
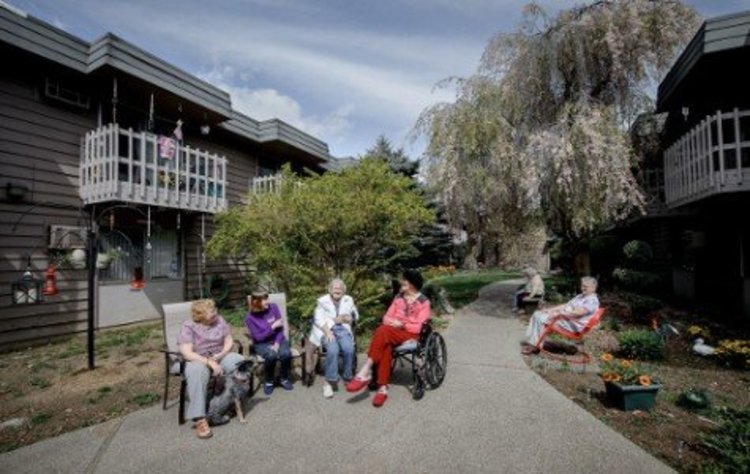
Whether enjoying our lush garden courtyard, a cookie bake in the craft room, a quiet read in our casual reading room or a veteran’s event in our conference room, Bestland Senior Living Community personifies what your new residence can be. Come experience the difference.
SHOW LESS